Intra-Commonwealth exports grew spectacularly, at around 10 per cent, during 2017 and 2018. However, COVID-19, together with various global economic exigencies prior to the pandemic, has subdued trade growth and affected exports from all Commonwealth regions. Many countries have been highly exposed to the effects of COVID-19 because of their large services sectors along with existing structural challenges and vulnerabilities; this is especially the case for least developed countries (LDCs) and small states. With the rollout of vaccines, some Commonwealth countries have started to open their economies and resume trade and travel but many others still face the challenge of combating the pandemic.
This chapter analyses the impact of COVID-19 on Commonwealth countries' global and intra-Commonwealth goods and services exports and explores the prospects for trade recovery. Some of the key takeaways are:
In 2020, intra-Commonwealth trade was estimated at US$641 billion and could have been $60 billion higher without the pandemic. All Commonwealth regions experienced adverse effects, although the Caribbean and Pacific island countries were relatively more affected because of their dependence on tourism and travel services.
Intra-Commonwealth trade continues to evolve as member countries deepen existing linkages or diversify trading partners within or outside the Commonwealth. Between 2005 and 2019, 24 member countries considerably increased their share of intra-Commonwealth trade.
Commonwealth small states depend the most on intra-Commonwealth trade, which represents 28 per cent of their world trade, on average. LDC members, especially Bangladesh and African countries, also have significant exports to Commonwealth markets.
The Commonwealth advantage remains strong and resilient and could provide a post-pandemic tailwind to support recovery. Revised estimates mean bilateral trade costs between Commonwealth country pairs are 21 per cent lower, on average, compared with non-Commonwealth countries.
Intra-Commonwealth exports are expected to rebound and surpass US$700 billion by 2022. Countries can leverage digital technologies, utilise trade agreements, promote services co-operation and improve connectivity to boost their trade, while the Commonwealth's youthful population offers another promising dividend for economic recovery.
1.1 Introduction
Commonwealth countries' trade has been affected significantly by the global slowdown in economic growth as a result of COVID-19 and the policy measures used to contain the spread of the virus, including economic lockdowns, travel restrictions and social distancing. The world economy contracted by 3.3 per cent in 2020, with particularly severe impacts on women, youth, the poor and the informally employed. Overall, Commonwealth countries suffered a loss of US$1.15 trillion to their gross domestic product (GDP) compared with the pre-pandemic estimate. During this time, 45 Commonwealth countries fell into recession, while only 9 developing country members registered positive growth - namely, Bangladesh, Brunei Darussalam, Ghana, Guyana, Malawi, Nauru, Tanzania, The Gambia and Tuvalu (see Annex 1.3). By contrast, when the global financial crisis hit more than a decade ago, less than half of the Commonwealth membership went into recession.
This chapter examines the impact of COVID-19 on the performance and prospects of the Commonwealth's global trade and trade among the 54 member countries. The demand, supply and policy shocks of the pandemic have affected countries' trade in multiple ways depending on the structure of their economies, the composition of their exports and their integration into global value chains (GVCs). For example, services like transportation, travel and tourism have been hit hard, and an initial collapse in commodity prices affected the Commonwealth's 35 commodity-dependent exporters. With the easing of lockdowns and restrictions in many countries, and the (uneven) rollout of vaccinations, merchandise trade is starting to lead an economic recovery. However, the revival of the services sector, which is the economic lifeblood of many Commonwealth small states, may take longer.
The chapter consists of seven sections. The next two sections analyse the composition and performance of Commonwealth countries' global and intra-Commonwealth trade during the pre-crisis period to establish a baseline for assessing their vulnerability to the pandemic's effects. Section 1.4 examines some of the actual impacts on the Commonwealth's goods and services trade; Section 1.5 looks specifically at the Commonwealth's 14 least developed countries (LDCs) in this regard.1 Given the focus on immediate economic recovery, Section 1.6 projects the Commonwealth's short-term trade prospects up to 2022. Section 1.7 concludes and offers ways forward.
1.2 The Commonwealth's global trade before the pandemic
1.2.1 Volume of trade and trends
Following a dramatic slowdown in world trade growth in the wake of the global financial crisis more than a decade ago, the trade flows of Commonwealth countries rebounded strongly in 2017 and 2018, with year-on-year growth of around 10 per cent. However, this promising recovery was cut short by economic headwinds, mainly the trade and technology conflict between the USA and China (see Chapter 4), which caused global trade to contract significantly in 2019.2 This global contraction contributed to weak growth in the Commonwealth's exports, which increased by only US$3.5 billion between 2018 and 2019. In 2019, prior to the onset of the COVID-19 pandemic, the combined value of the Commonwealth's global goods and services exports was $3.73 trillion (Table 1.1). Developing country members contributed around half of these global exports, making up the greater share of goods trade.
Source: Commonwealth Secretariat (calculated using UNCTADstat and WTO-OECD BaTIS datasets)
In absolute terms, the Commonwealth's total exports to the world almost doubled from 2005 (US$2.1 trillion) to 2019 ($3.73 trillion). However, their corresponding share of global exports declined marginally, from 16.2 per cent to 15.1 per cent of world exports ($24.9 trillion) (Figure 1.1). China, which is now the world's largest exporter, contributed to this declining share, as did growth in other large developing countries outside the Commonwealth. At the same time, the share of intra-Commonwealth trade in member countries' overall world trade is rising, having grown from around 16 per cent in 2005 to more than 18 per cent in 2019.
Figure 1.1 Commonwealth countries' global exports of goods and services, 2005-2019
Note: The chart presents total global exports of 54 Commonwealth member countries, good and services combined. Source: Commonwealth Secretariat (calculated using UNCTADstat and WTO-OECD BaTIS datasets)
In tandem with changes in the size and relative proportion of the Commonwealth's trade with the world, there have been some significant shifts in the drivers of Commonwealth trade since the 2018 Commonwealth Trade Review. There has been a convergence in the relative contributions of the developed countries - namely, Australia, Canada, Cyprus, Malta, New Zealand and the UK - and the 48 developing country members to the Commonwealth's world trade.3 The share of developing countries in the Commonwealth's total exports increased steadily from 40 per cent in 2005 to nearly 50 per cent in 2017 (Figure 1.2).4 Commonwealth Asian countries, led by India, are driving this convergence, having more than doubled their exports to US$1.51 trillion in 2019 (from $635 billion in 2005). This has translated into a rising share in total Commonwealth trade for Asian countries, from 31 per cent in 2005 to 41 per cent in 2019. The exports of Pacific small island developing states (SIDS) increased nearly threefold to around $15.9 billion in 2019. However, their share in total trade increased only marginally, from 0.3 per cent in 2005 to 0.4 per cent in 2019.
Figure 1.2 Evolution of Commonwealth members' exports, by development level and sector, 2005-2019
Source: Commonwealth Secretariat (calculated using UNCTADstat and WTO-OECD BaTIS datasets)
Pre-pandemic headwinds also affected the trade flows of the Commonwealth's 32 small states. In 2019, their combined global exports were US$115 billion while their intra-Commonwealth exports were around $33 billion, almost $1 billion less than the level reached in 2018 (Figure 1.3). In relative terms, small states' goods and services exports amount to 0.45 per cent of global exports and 3 per cent of overall Commonwealth exports. Malta and Cyprus contribute the largest share - about one-third (or $37 billion) - of small states' exports. The top three exporters from developing regions were Papua New Guinea ($11.6 billion), Brunei Darussalam ($7.6 billion) and Jamaica ($6 billion) in 2019.
Figure 1.3 Trade performance and composition of Commonwealth small states' exports, 2005-2019
Source: Commonwealth Secretariat (calculated using UNCTADstat and WTO-OECD BaTIS datasets)
Most of the trade challenges facing small states precede COVID-19 and involve excessively high trade costs as a result of their small size and remote geography, diseconomies of scale, inadequate infrastructure, concentrated production and export sectors, and vulnerability to climate change and recurrent natural disasters. The trade and sustainability challenges, especially in the fisheries and tourism sectors, will now have to be tackled in tandem through devising post-COVID-19 recovery and resilience strategies, as discussed in Chapter 5.
1.2.2 Structure and composition of trade
More than two-thirds of the Commonwealth's global trade is in merchandise. In 2019, goods exports were worth US$2.5 trillion (68 per cent of overall trade) while services contributed $1.18 trillion (32 per cent) (Table 1.1).
The UK was the largest exporter of both goods and services, accounting for around 24 per cent of total Commonwealth trade. In 2019, the UK's goods exports were about US$468 billion (19 per cent of total Commonwealth goods exports) while its services exports were $416 billion (35 per cent of total Commonwealth services exports).
Only a few large economies within each Commonwealth region drive the Commonwealth's global exports. Ten countries accounted for 94 per cent of total merchandise exports5 and 93 per cent of services exports6 in 2019 (Annex 1.1). Most of these economies contracted as a result of the pandemic. This affected their overall trade flows, as well as intra-Commonwealth trade, in 2020. The pace of economic recovery in these countries will determine the prospects for trade growth beyond COVID-19.
Commonwealth countries are active participants in the global services economy. The contribution of services exports to GDP varies enormously across developed and developing countries and regions (Figure 1.4). Developed countries have the highest share, at almost 60 per cent. Among developing countries, the Caribbean and Pacific regions have larger proportions of services exports in their GDP (54 per cent and 39 per cent, respectively). This owes to the predominance of tourism and travel services, especially in the Caribbean. The share of services exports in the GDP of the Asian (34 per cent) and African (20 per cent) regions is relatively small but still higher than the world average.
Figure 1.4 Share of Commonwealth services exports in GDP by region, 2019
Note: Nauru excluded owing to non-availability of data; the dotted line indicates the world average. Source: Commonwealth Secretariat (calculated using WDI data)
Merchandise exports
Commonwealth developing countries are the largest merchandise exporters, at US$1.28 trillion in 2019. However, there is wide variation within the Commonwealth's developing regions, as the following stylised facts reflect.
Asian members are overwhelmingly the leading exporters of goods, with exports valued at US$1.03 trillion in 2019 (68 per cent of their total exports). Three Asian countries accounted for around 40 per cent of these exports: Singapore ($390 billion or 16 per cent), India ($323 billion or 13 per cent) and Malaysia ($238 billion or 9 per cent).
For Commonwealth Africa, goods contributed more than 80 per cent of their exports in 2019 (Annex 1.1). Three sub-Saharan African (SSA) members accounted for almost 80 per cent of the region's total merchandise exports: South Africa ($90 billion or 41 per cent), Nigeria ($65 billion or 29 per cent) and Ghana ($16 billion or 8 per cent).
The Pacific SIDS depend the most on goods exports (82 per cent) and the least on services (18 per cent). In 2019, Papua New Guinea was the largest exporter (US$11.41 billion), accounting for more than 87 per cent of the region's exports and almost 10 times the value of the next ranking country, Fiji ($1.61 billion).
The Caribbean SIDS have narrow production sectors, such as offshore oil and gas, fisheries and commodities like bananas and sugar. In 2019, Trinidad and Tobago accounted for two-thirds of the region's goods exports, valued at US$8 billion, followed by Guyana ($1.7 billion) and Jamaica ($1.6 billion).
Services exports
Commonwealth developed countries are the largest exporters of services, valued at US$634 billion in 2019 (Table 1.1). Among these countries, the UK supplied almost one-third of the Commonwealth's services exports (see Figure 1.5), of which around one-third was financial services (US$80 billion) and travel services ($50 billion). However, their share in overall services exports is declining - from 69 per cent in 2005 to 53 per cent in 2019 - because developing countries, especially Asian members, are increasingly important players in this sector. India and Singapore together accounted for around one-third of the Commonwealth's services exports, comprising mainly business services and information technology (IT) support.
Figure 1.5 Leading services exporters and key services sectors, 2019
Source: Commonwealth Secretariat (calculated using WTO-OECD BaTIS dataset)
Commonwealth African members have one of the lowest shares of services exports (19 per cent). South Africa, Ghana and Kenya are the largest services suppliers, accounting for 57 per cent of the region's services exports; Rwanda is also an important services player. Among the SSA membership, only two countries export more services than goods - namely, Mauritius (US$2.9 billion in 2019) and Seychelles ($1.1 billion). More than half of these exports were travel or tourism-related.
The Caribbean SIDS have the largest orientation towards trade in services; around 54 per cent of their exports comprise services, especially related to tourism. The COVID-19 pandemic has affected these sectors significantly.
Travel, an aggregate of tourism and business travel, is the largest category, amounting to around one-fifth of total services exports. The other three big services categories are transport, information and communication technology (ICT) and financial services. These three groups combined account for around 40 per cent of services exports (Figure 1.5). Given the importance of tourism in Commonwealth services trade, it is likely that the COVID-19 pandemic, which has made in-person travel both more difficult and less appealing to consumers, has had a major depressive effect on this trade. ICT and financial services, by contrast, could see different dynamics at play: in-person interactions have become more difficult but there has also been some shift towards online service provision (Shepherd and Shingal, 2021; see Chapter 2). The same applies to intra-Commonwealth services trade in these sectors.
1.3 Intra-Commonwealth trade before the pandemic
1.3.1 Volume of trade and trends
Intra-Commonwealth trade is historically and commercially significant for many members, especially small states, LDCs and SSA countries. The "Commonwealth advantage" has helped build, strengthen and sustain many of these trading relationships (Box 1.1). Factors such as historical ties, familiar legal and administrative systems, the use of largely one language, English, as the means of communicating with foreign partners, and large and dynamic diasporas underpin this advantage, which is particularly significant for trade in services (Commonwealth Secretariat, 2015).
The Commonwealth advantage remains compelling for many member countries and could provide a post-pandemic tailwind to support recovery from the economic consequences of the pandemic. Indeed, re-examination of the Commonwealth advantage with the availability of a refined bilateral trade costs dataset for a longer period reveals the resilience and strengthening of this cost advantage for trading between Commonwealth countries, to 21 per cent, on average.
Box 1.1 Trade costs advantage in intra-Commonwealth trade
The Commonwealth advantage implies that Commonwealth member countries have on average 19 per cent lower trade costs in their bilateral trade than in trade with non-member countries (Commonwealth Secretariat, 2015). The revised estimates calculated with the most up-to-date datasets (1995-2017) indicate that, on average, aggregate bilateral trade costs between Commonwealth country pairs are lower to the tune of around 21 per cent7 compared with the cost of trading with non-Commonwealth countries (Table 1.2). The trade cost advantage holds for both agricultural products and manufactured goods (columns 2 and 3) but the magnitude of the effect varies marginally across sectors, mainly because of data limitations resulting in different sample sizes. A slightly lower coefficient in the manufacturing sector (column 3), besides indicating the variation in sample size, could reflect relatively lesser trade costs owing to lower tariffs in manufacturing sectors.
Table 1.2 The Commonwealth effect on trade costs
Overall
Agriculture
Manufacturing
(1)
(2)
(3)
Commonwealth membership
-0.192***
-0.186***
-0.171***
Distance (km)
0.443***
0.373***
0.473***
Origin-year FE
Yes
Yes
Yes
Dest.-year FE
Yes
Yes
Yes
Sample size
333,668
184,824
298,968
CW countries
53
51
52
Period
1995-2017
1995-2017
1995-2017
R-squared
0.71
0.58
0.71
Note: The dependent variable is bilateral trade costs. The estimated coefficients are statistically significant at 1 per cent level, as indicated by ***. Estimated using the OLS panel regression method.
Source: Commonwealth Secretariat (estimated using World Bank Trade Costs dataset)
Many factors, such as distance, language, legal systems and tariffs, influence trade costs, with transport just one of the overall costs of international trade. This means the data for bilateral trade costs is very limited. To circumvent this challenge, Arvis et al. (2016) use an inverse gravity approach to infer bilateral trade costs between countries. This approach has a micro-foundation as it is based on a theoretical model developed in Novy (2013). Following this approach, the United Nations Economic and Social Commission for Asia and the Pacific (UNESCAP) and the World Bank have developed a global database on bilateral trade costs for 180 countries over 1995-2017, including 53 Commonwealth countries (excluding Solomon Islands). These bilateral trade costs are interpreted in a similar way to ad valorem equivalents.
The dataset of Arvis et al. (2016) has been used to empirically test whether the Commonwealth is indeed associated with reduced trade costs between its members. A regression of bilateral trade costs on a binary indicator for whether the two countries are Commonwealth members is estimated. The results, shown in columns 1 and 2 of Table 1.2, provide strong evidence that the Commonwealth is associated with lower trade costs. The estimated coefficient for the binary indicator, the Commonwealth membership, is statistically significant at a 1 per cent significance level. Even when distance in combination with time-varying fixed effects for countries is accounted for, bilateral trade costs are 21 per cent lower for Commonwealth partners than for other pairs of countries (i.e. Commonwealth and non-Commonwealth or both countries non-Commonwealth).
An analysis of bilateral trade costs for different sample partners reveals that the trade costs between Commonwealth country pairs have been consistently lower over time (Figure 1.6). For example, in 2000, average bilateral trade costs for intra-Commonwealth partners were 260 per cent as against 293 per cent for Commonwealth and non-Commonwealth bilateral pairs. These results seem to be consistent with the findings of rising intra-Commonwealth trade as a share of the Commonwealth's global trade over time.
Figure 1.6 Share of average trade costs between Commonwealth trade partners vs. others, 1995-2018
Source: Commonwealth Secretariat (calculated using World Bank Trade Costs dataset)
Intra-Commonwealth trade in goods and services was worth US$672 billion in 2019, with almost two-thirds of trade being in merchandise (Table 1.3). The growth of intra-Commonwealth trade, like global trade, has been constrained by various pre-COVID-19 headwinds.
Table 1.3 Share of goods and services in intra-Commonwealth exports, 2019
Goods Value (US$ million)
%
Services Value (US$ million)
%
Commonwealth
433,892
65
238,755
35
By development
Developed
125,026
57
93,587
43
Developing
308,866
68
145,168
32
By region
Africa
75,815
85
13,539
15
Asia
225,386
64
127,067
36
Caribbean and Americas
29,317
65
15,514
35
Caribbean SIDS
2,737
43
3,559
57
Europe
39,108
43
51,360
57
Pacific
64,266
67
31,275
33
Pacific SIDS
4,927
83
1,003
17
Note: The percentage share indicates the share of goods and services in the corresponding group.
Source: Commonwealth Secretariat (calculated using UNCTADstat and OECD-WTO BaTIS datasets)
Developing countries are the largest exporters of goods (68 per cent); in absolute terms, they export 2.5 times more merchandise than the developed economies. As with the global pattern, developed countries accounted for a larger share of intra-Commonwealth services trade (43 per cent) in 2019.
Intra-Commonwealth merchandise trade has gradually increased over time, from US$240 billion in 2005 to $433 billion in 2019. The corresponding increase in services trade was much larger, from $98 billion in 2005 to $238 billion in 2019 - an almost three-fold increase (Figure 1.7).
Figure 1.7 Trends in intra-Commonwealth exports of goods and services, 2005-2019
Source: Commonwealth Secretariat (calculated from UNCTADstat and OECD-WTO BaTIS datasets)
The share of intra-Commonwealth trade in Commonwealth members' total world trade has been rising since 2005, reaching a peak of 19.3 per cent in 2012 before a global trade slowdown (2012-2015) constrained growth. In 2018 and 2019, the share of intra-Commonwealth trade remained steady at around 18 per cent.
Commonwealth developing countries drive intra-Commonwealth trade flows. Over time, the developing countries' export share increased (from 60 per cent in 2005 to 67 per cent in 2019), while their exports almost doubled in value terms, going from US$204 billion to more than $450 billion in the same period.8 This shift owes largely to the greater expansion of trade by Asian member countries, which increased their intra-Commonwealth share to almost 53 per cent in 2019.
Overall, reflecting the global pattern, only a few large economies drive intra-Commonwealth trade. The UK alone accounted for around 40 per cent of the share of the developed economies in 2019. The UK also led services exports (46 per cent), while Australia had the largest share of merchandise trade (39 per cent). Among developing countries, Singapore, India and Malaysia together accounted for 93 per cent of exports of goods as well as services for Asian members (Annex 1.1).
Intra-Commonwealth trade has evolved as member countries deepen existing trade linkages or diversify their trading partners within or outside the Commonwealth. Between 2005 and 2019, 24 member countries considerably increased their share of intra-Commonwealth trade, including several small states (Annex 1.4). For instance, over this period, the share of intra-Commonwealth trade in Vanuatu's exports rose from 15 per cent to around 50 per cent, trading largely with Australia, New Zealand, Singapore, Fiji and Malaysia. Other members successfully diversified their trading partners, resulting in lower shares of intra-Commonwealth trade.
Commonwealth small states depend the most on intra-Commonwealth trade, which represents 28 per cent of their world trade, on average. Their share of merchandise in intra-Commonwealth exports (31 per cent) is considerably higher than that of services (26 per cent). However, there is wide variation among these small economies (Figure 1.8). During 2017-2019, the share of intra-Commonwealth exports ranged from 6 per cent (for Kiribati) to more than 80 per cent (for Eswatini), while imports vary from 10 per cent (for The Bahamas) to 82 per cent (for Botswana). Most of this intra-Commonwealth trade takes place regionally. The prominence of intra-Commonwealth imports for Botswana, Eswatini, Lesotho and Namibia owes to their membership, together with South Africa, in the Southern African Customs Union (SACU). Dominica and Grenada's high export shares owe to their membership in the Caribbean Community (CARICOM) and the Organisation of Eastern Caribbean States (OECS). These economies have also gained prominence in intra-Commonwealth services exports (Figure 1.9).
Figure 1.8 Relative significance of intra-Commonwealth merchandise trade in member countries' total trade, 2017-2019 average
Source: Commonwealth Secretariat (calculated using UNCTADstat dataset) *St Vincent and the Grenadines due to space constraints
Figure 1.9 Relative significance of intra-Commonwealth services exports in member countries' total services exports, 2017-2019 average
Source: Commonwealth Secretariat (calculated using WTO-OECD BaTIS dataset) *St Vincent and the Grenadines due to space constraints
The Commonwealth's 14 LDCs also depend significantly on intra-Commonwealth trade; this is especially the case for Bangladesh and the African LDCs. In absolute terms, Bangladesh is the largest LDC exporter, sending almost three times more goods and services combined to the Commonwealth than the next ranked countries - Tanzania, Zambia and Mozambique (Annex 1.5). However, the nine SSA LDCs contributed just over half of LDCs' intra-Commonwealth exports (US$19.01 billion) in 2019.
Intra-African trade accounts for a large share of this intra-Commonwealth LDC trade. Around 15-30 per cent of the exports of four LDCs - Zambia, Mozambique, Tanzania and Uganda - are with other African Commonwealth countries. LDCs' structure of intra-Commonwealth trade closely mirrors that of their global exports. Although merchandise exports dominate their trade flows, the share of services is slightly higher than in their global exports. For the Pacific LDCs, services constitute more than 70 per cent of their intra-Commonwealth exports.
1.3.2 Regional distribution of intra-Commonwealth trade
Intra-Commonwealth trade is highly regional in nature, especially because of the operations of regional production networks and supply chains, which COVID-19 has brought into greater focus. Moreover, trade between Commonwealth countries is found to be more than three times higher when they belong to an existing trade agreement (Commonwealth Secretariat, 2018a; see Chapter 4). Five Commonwealth regions are used to analyse intra-Commonwealth trade - and investment (see Chapter 3) - flows: Africa, Asia, Caribbean and Americas (Canada and the Caribbean SIDS), Europe and the Pacific (Australia, New Zealand and the Pacific SIDS).
Commonwealth Asia now contributes more than half of intra-Commonwealth trade. The share of the Asian economies had risen by 4 percentage points to 52.5 per cent in 2019 (Figure 1.10). During the same period (between 2010 and 2019), the shares of the African, Caribbean, Pacific and European members declined marginally, although their exports did increase in absolute terms. In the Pacific region, Australia and New Zealand drive intra-Commonwealth trade; Canada is the leading exporter in the Caribbean and Americas region. Though Caribbean SIDS increased their exports in value terms, their relative share of intra-Commonwealth trade declined from 1.1 per cent in 2010 to 0.9 per cent in 2019. The Pacific SIDS, on the other hand, registered a marginal increase both in value and in relative terms. This reflects the large trade orientation of Pacific islands towards Australia and New Zealand.
Figure 1.10 Regional distribution of intra-Commonwealth trade, 2010 vs. 2019
Source: Commonwealth Secretariat (calculated using UNCTADstat and WTO-OECD BaTIS datasets)
In Commonwealth Africa, more than 75 per cent of exports originated in three members: South Africa, Nigeria and Ghana. South Africa is the largest intra-Commonwealth exporter, for both goods and services, accounting for 42 per cent of merchandise exports and 30 per cent of services exports. Thereafter, Nigeria and Ghana are the two largest merchandise exporters, while Ghana and Kenya are the largest services exporters, in that order (Figure 1.11). Rwanda is also a prominent services exporter, especially given its attraction as a tourist destination, mainly for gorilla watching.
Figure 1.11 Share of goods and services exports for leading exporters, by region, 2019
Source: Commonwealth Secretariat (calculated using UNCTADstat and WTO-OECD BaTIS datasets)
Looking specifically at the Caribbean SIDS, three economies (Trinidad and Tobago, Jamaica and The Bahamas) accounted for 57 per cent of the Caribbean SIDS' intra-Commonwealth exports in 2019. Trinidad and Tobago accounted for 43 per cent of merchandise exports, followed by Guyana and Jamaica; Jamaica, The Bahamas and Barbados are leading services traders.
Among the Pacific SIDS, two economies (Papua New Guinea and Fiji) accounted for 93 per cent of the Pacific islands' intra-Commonwealth exports in 2019. The trade distribution is very much concentrated: Papua New Guinea alone accounted for 90 per cent of merchandise exports while Fiji accounted for around 60 per cent of services exports.
1.3.3 Structure and composition of intra-Commonwealth trade
Intra-Commonwealth merchandise trade
Amid a global trade contraction, the value of intra-Commonwealth merchandise trade in 2019 dropped to US$433 billion, a loss of $8 billion on 2018. The abrupt recessions caused by COVID-19 in several large Commonwealth traders, including India, Singapore, South Africa and the UK, further dampened trade growth in 2020.
Similar to the pattern of Commonwealth total trade, Asian countries continue to drive intra-Commonwealth exports and imports of goods, in absolute terms (Figure 1.12). Three countries, Singapore, India and Malaysia, are the largest merchandise exporters, accounting for half of total exports in 2019. India and Singapore are also the largest importers. This pattern has remained largely consistent over time.
Figure 1.12 Shares of large intra-Commonwealth merchandise traders, 2019
Source: Commonwealth Secretariat (calculated using UNCTADstat dataset)
Among Commonwealth developed countries, the UK was the fifth-largest exporter and the third-largest importer while Canada was the seventh-largest exporter and the sixth-largest importer in 2019. This owes to the significant regional trade of these economies - namely, the UK with the EU and Canada with the USA and Mexico.
Two sectors contributed almost half of intra-Commonwealth merchandise exports: manufactured goods (US$250 billion, or almost 60 per cent) and commodities comprising minerals and fuels ($99.5 billion, or 23 per cent) (Figure 1.13). The preponderance of manufacturing in the overall goods exports of Commonwealth Europe (86 per cent) and Asia (67 per cent) suggests these countries were relatively more exposed to COVID-19-related demand and supply disruptions to this sector and trade. Commonwealth Africa, where non-manufactured goods comprise around 60 per cent of merchandise exports, was more vulnerable to volatility in commodity prices, which affected the revenues of several commodity-dependent countries (see Box 1.6).
Figure 1.13 Intra-Commonwealth merchandise exports by sector and region, 2019
Note: "Other commodities" includes gold and coins (non-monetary). Source: Commonwealth Secretariat (calculated using UNCTADstat dataset)
Intra-Commonwealth services trade
Services trade is an important component of Commonwealth countries' exports, as noted earlier in this chapter. Intra-Commonwealth services exports are growing rapidly, having more than doubled from around US$98 billion in 2005 to $238 billion in 2019.
Developing countries are the leading services suppliers, accounting for around 60 per cent of intra-Commonwealth exports in 2019. Services exports by Asian countries, especially India, Singapore and Malaysia, have become more significant in recent years.
In 2019, Singapore was the largest intra-Commonwealth services exporter while India was the largest services importer (Figure 1.14). Almost all the developed countries are ranked in the top 10 intra-Commonwealth services traders. The UK is the second-largest exporter and the third-largest importer of services, followed by Australia, which is the fourth-largest importer and exporter. Of the African members, only South Africa and Nigeria rank among the top 10 services economies.
Figure 1.14 Country shares of intra-Commonwealth services exports and imports, 2019
Source: Commonwealth Secretariat (calculated using OECD-BaTIS dataset)
In 2019, around 53 per cent of intra-Commonwealth services exports originated from Asia, followed by 22 per cent from the three European members. The share of the Pacific members, although relatively smaller, is higher than the combined share of African and Caribbean members (Figure 1.15).
Figure 1.15 Regional and sectoral distribution of intra-Commonwealth services exports, 2019
Source: Commonwealth Secretariat (estimated using WTO-OECD BaTIS dataset)
The sectoral composition of intra-Commonwealth services trade displays significant vulnerabilities to a shock like COVID-19. Travel is the largest category, accounting for almost 30 per cent of services exports - and this is larger than the corresponding global share (21 per cent), as discussed earlier. The share of transport services (16 per cent) and ICT services (13 per cent) combined is around 30 per cent. Although many services sectors, such as education, financial services and health, have adapted by delivering more online, communal services such as events and hospitality require in-person interaction.
The growth of intra-Commonwealth services exports has been marginally higher than the global growth rate for this sector. During 2005-2019, intra-Commonwealth services exports grew at around 6.88 per cent per annum while the growth rate of world services trade was around 6.38 per cent (Figure 1.16). The growth rate of intra-Commonwealth services exports in this period was also slightly higher than the same for Commonwealth countries' global exports (6.45 per cent). This is driven partly by the increase in exports of services by developing economies, especially Singapore and Malaysia, as well as the effect of the Commonwealth advantage in driving trade in services. This servicification trend is observed in both developed and developing countries (Box 1.2).
Figure 1.16 Growth rate of intra-Commonwealth services exports, 2005-2019 average
Source: Commonwealth Secretariat (estimated using WTO-OECD BaTIS dataset)
Box 1.2 Rising servicification trends in Commonwealth developing and developed countries
The process of servicification has two main components. On the one hand, changes in consumption patterns as a result of increasing per capita incomes tend to shift demand and therefore production towards services. At the same time, technological change means that more activities within industrial firms are in fact services. During 2005-2019, Commonwealth developed economies increased their share of intra-Commonwealth services exports as well as services imports. A similar trend is observed in developing members (Figure 1.17) but their services exports have grown at a much faster pace.
Figure 1.17 Servicification of intra-Commonwealth trade over time
Source: Commonwealth Secretariat (calculated using UNCTADstat and OECD-WTO BaTIS dataset)
1.4 COVID-19 implications for Commonwealth trade
COVID-19 has caused severe economic disruptions to the Commonwealth and globally. The global recession and GDP contraction in major trading partners (Box 1.3), together with various COVID-19-related disruptions, have dealt a strong blow to Commonwealth countries' exports. For 2020, the Commonwealth's global trade flows are estimated at US$3.55 trillion. This amounts to a drop of $145 billion from 2019.
Box 1.3 COVID-19 and economic contractions in the Commonwealth's largest export markets
International trade is highly responsive to changes in market size. COVID-19 has constrained economic growth in the Commonwealth's major export markets, adversely affecting demand for goods and services (Figure 1.18). Apart from China, where GDP expanded by 2.3 per cent, the other major destinations for Commonwealth exports recorded significant contractions in GDP in 2020. In India and Singapore, GDP declined by more than 5 per cent. In the USA, which absorbs 31 per cent of developed members' goods and services exports and 12 per cent of those from developing members, GDP contracted by 3.5 per cent. The EU, which collectively represents the second-largest market for Commonwealth exports, contracted by 6.6 per cent. Within the EU-27, growth in the three top destinations for Commonwealth exports - Germany, France and the Netherlands - fell by 4.9 per cent, 8.2 per cent and 3.7 per cent, respectively. Similarly, the GDP of the UK, a key destination for intra-Commonwealth exports (see Chapter 5), contracted by around 9.9 per cent.
Figure 1.18 Commonwealth market share and GDP drop for large export markets (%)
Note: The left panel reflects combined share of goods and services. EU-28 includes the UK because it was an EU member until 31 January 2020. China and Hong Kong are aggregated in the left panel. Source: Commonwealth Secretariat (calculated using UNCTADstat and WTO-OECD BaTIS datasets and data from the IMF and World Bank Outlook)
These markets collectively absorb around 75 per cent of Commonwealth developed members' exports and around half from developing countries. Most of these economies are still under varying degrees of lockdown. The protracted pandemic, coupled with an on-going deep recession, not only has adversely affected short-term export demand but also portends serious challenges for a quick trade recovery in both Commonwealth developed and developing countries in 2021. Aside from these direct implications for trade in goods and services, a reduction in growth in these major economies could have several indirect knock-on effects for Commonwealth developing members, including through reduced Aid for Trade and other official development assistance to LDCs and highly vulnerable small states.
Relative to pre-pandemic growth trends, Commonwealth economies are estimated to contract by around 10 per cent in 2020 (Annex 1.2). This economic contraction has directly translated to a drop in trade flows (Figure 1.19), but with a varying effect across Commonwealth regions and development levels. Although global exports from all Commonwealth economies have declined, the drop is relatively higher for developing Commonwealth countries, whose exports have contracted by around 10.1 per cent. This could reflect, among others, limited economic support to the firms and businesses in these countries during the pandemic. Second, these countries largely rely on the export markets of advanced economies, which are still reeling from COVID-19. In absolute terms, Asian economies suffered the largest decline in exports (at US$146 billion), followed by African ($20 billion), Caribbean ($4.2 billion) and Pacific members (1.3 billion). However, in relative terms, the Caribbean SIDS underwent a greater slump. Their global exports shrank by almost 20 per cent. These SIDS largely rely on the exports of services, particularly travel and tourism, which were hit hard in this pandemic (see Chapter 5).
Figure 1.19 Impact of the COVID-19 pandemic on Commonwealth countries' global exports in 2020
Note: Calculated as the difference between pre-COVID (October 2019) and in-COVID (April 2021) estimates of the IMF. The GDP estimates are used to compute trade flows at country and regional levels. Source: Commonwealth Secretariat (calculated using UNCTADstat and WDI datasets and IMF and World Bank data)
Intra-Commonwealth trade flows are estimated at around US$641 billion in 2020. Compared with the pre-pandemic projection ($701 billion), this suggests an export loss of $60 billion in a single year. The pandemic has affected the intra-Commonwealth exports of all regions (Table 1.4). However, in absolute terms, Asian economies have suffered the biggest decline in exports (at $36 billion), followed by African ($6.5 billion), Caribbean ($ 4.2 billion) and Pacific members ($5 billion). Among these groupings, the Caribbean SIDS are the most affected in relative terms, with their intra-Commonwealth exports shrinking by almost 16 per cent in 2020. All leading intra-Commonwealth exporters have been affected (Figure 1.20).
Figure 1.20 COVID-19 shock and intra-Commonwealth trade flows in goods and services, 2019 vs. 2020
Note: Calculated as the difference between pre-COVID (October 2019) and in-COVID (April 2021) estimates of the IMF. The GDP estimates are used to compute trade flows at country and regional levels. Source: Commonwealth Secretariat (calculated using UNCTADstat and WDI datasets and IMF and World Bank data)
Table 1.4 Regional variation in COVID-19 impact on intra-Commonwealth trade (US$ million), 2019 vs. 2020
2019
2020 (Pre- and in-COVID)
Forecast
Actual
Commonwealth
672,647
701,248
641,316
By development
Developed
218,613
234,420
216,220
Developing
454,034
466,737
425,096
By region
Africa
89,354
99,395
92,797
Asia
352,452
357,915
321,330
Caribbean and Americas
44,831
50,746
46,594
Caribbean SIDS
6,296
6,715
5,662
Europe
90,468
96,644
86,017
Pacific
95,541
99,548
94,577
Pacific SIDS
5,931
5,803
5,306
Note: Calculated as the difference between pre-COVID (October 2019) and in-COVID (January 2020) estimates of the IMF and World Bank. The GDP estimates for 2020 are used to compute trade flows at country and regional levels Source: Commonwealth Secretariat (calculated using UNCTADstat and WDI datasets and IMF and World Bank data)
1.4.1 COVID-19 and goods trade
With two-thirds of the Commonwealth's global and intra-Commonwealth trade being in manufactured goods and commodities, many member countries, especially developing countries, have been hit hard by the real economy consequences of COVID-19.
The pandemic has adversely affected the global and intra-Commonwealth merchandise exports of member countries since early January 2020, immediately after the outbreak of the coronavirus in China in December 2019. However, the greatest effect occurred during April and May 2020, when many large export markets in Europe and the USA imposed lockdowns. In these two months, exports of Commonwealth members dropped to almost half compared with the baseline (Figure 1.21). The impact was relatively higher for intra-Commonwealth exports compared with global exports as many of the large intra-Commonwealth traders - including India, Singapore, South Africa and the UK - experienced an economic contraction, affecting the supply and demand of their merchandise (see Box 1.4). Exports plateaued in May 2020 but rebounded in June 2020 as firms sought to adapt to the containment measures. Merchandise exports are gradually recovering as lockdowns and restrictions on economic activities are lifted in many countries. However, in December 2020, the Commonwealth's exports were still well below the pre-pandemic level in December 2019.
Figure 1.21 Impact of the pandemic on Commonwealth merchandise exports, December 2019 to December 2020
Note: Exports are indexed to 1 in December 2019. As a result of data reporting delays in LDCs and small states, the chart contains information for only 25 Commonwealth countries. Source: Commonwealth Secretariat (calculated using ITC data)
The drop in Commonwealth countries' exports has strong linkages with the incidence of the virus (see Box 1.4). Countries with high numbers of infections (and deaths) and with strict lockdowns have also experienced a large decline in trade flows.
Box 1.4 Linkages between COVID-19 infections and merchandise exports in the Commonwealth
In a study for the Commonwealth Secretariat, Khorana and Martínez-Zarzoso (2021) estimate a gravity model on monthly trade flow data to explore the effect of incidence of COVID-19 on Commonwealth members' global and intra-Commonwealth merchandise exports. The results provide strong evidence of a correlation between the Commonwealth's exports and the number of infections, deaths and stringency of lockdowns9 in source and destination markets. A 10 per cent increase in the number of COVID-19 infections in the exporting country decreases exports by 0.33 per cent. The corresponding effect for the number of deaths is slightly lower (0.028 per cent) but that for the stringency index is higher, at about 0.4 per cent. The drop reflects interruptions in production and exporting activities in the short term at the onset of the pandemic (Table 1.5).
The estimated trade decline for five Commonwealth countries - Canada, India, Pakistan, South Africa and the UK - is very high (above 10 per cent). These five economies account for around 60 per cent of the Commonwealth's global exports and 40 per cent of intra-Commonwealth exports. The relatively high incidence of COVID-19 in these countries, in terms of numbers of infections and deaths, directly explains a larger decline in the Commonwealth's trade flows. By contrast, the Pacific SIDS have largely been shielded from the health effects of COVID-19. Moreover, these economies have relatively lesser proportions of merchandise in their exports, which is reflected in a relatively small drop in their goods trade (less than 5 per cent).
These regression results are robust to alternative estimation approaches (Pseudo Poisson Maximum Likelihood, PPML, and Ordinary Least Squares, OLS), using monthly lagged data (to account for simultaneity bias), and to the inclusion of a rigorous set of exporter and importer fixed effects to account for omitted variables and multilateral resistance. They also hold when the gravity variables - namely, distance, free trade agreement (FTA), common language and common border - are replaced by bilateral fixed effects. The projections of trade trends in the short term present a negative change in exports for all countries, raising the need for policy interventions and support to increase the resilience of supply chains.
The Bahamas, Belize, Botswana, Cyprus, Eswatini, The Gambia, Guyana, Malawi, Malaysia, Malta, Mozambique, Namibia, New Zealand, Rwanda, Sierra Leone, Sri Lanka, Trinidad and Tobago, Uganda
COVID-19 has impacted goods trade through both supply and demand shocks. Quarantines, lockdowns, social distancing and high levels of uncertainty have led to a significant drop in demand for goods and services, with GVCs transmitting the economic shock to upstream supplier countries (Escaith and Khorana, 2021). For example, reduced consumer demand and supply shocks have hit garment manufacturers and workers in the Commonwealth, especially in Bangladesh and Lesotho (Box 1.5).
Box 1.5 COVID-19 hits garments manufacturing in the Commonwealth
Global garment supply chains are highly integrated, making them extremely susceptible to the disruptions to trade and the movement of goods and persons caused by COVID-19. In the early stages of the pandemic, lockdowns in China resulted in severe delays to Chinese exports of raw materials (including fabric), with significant impacts on production for garment manufacturers in Bangladesh and other garment-producing Commonwealth countries that rely heavily on imported inputs. Across the Asia-Pacific region, garment manufactures have faced disruptions to up to 60 per cent of their supplies of imported inputs (ILO, 2020).
Lockdowns and mandatory closures of clothing retail stores in Europe, the USA and the world led to a sharp fall in consumer demand. This had a severe impact on garment manufacturing industries in Bangladesh, Lesotho and other Commonwealth countries that supply large quantities of garments to these markets. In the first half of 2020, garment-producing countries across Asia saw their exports to major buying countries fall by up to 70 per cent (ILO, 2020).
Some suppliers were hit with large-scale cancellation or postponement of production orders, often retrospectively in cases where orders were already in process or on the verge of completion.10 Many manufacturers also suffered delays to payments for completed orders, with buyers invoking "force majeure" clauses in their contracts. The direct health effects of COVID-19 have also impacted the availability of workers, dealing a further blow to production capacity in garment-producing Commonwealth countries.
The adverse impacts on the industry have major implications for garment sector workers, particularly women, who comprise most factory workers in key Commonwealth garment manufacturing countries (including Bangladesh, India, Lesotho, Pakistan and Sri Lanka). Many workers were already paid low wages and had poor job security and weak social safety nets even before the pandemic, and these vulnerabilities have been exacerbated.11 In addition, incomes decreased among many workers who had retained their jobs, falling by 21 per cent, on average, between March and August 2020 compared with pre-pandemic levels (Worker Rights Consortium, 2020).
If these production constraints persist, there is a risk that clothing brands may shift their manufacturing away from some Commonwealth members in favour of other sourcing locations to mitigate supply chain risks (Teodoro and Rodriquez, 2020). This would feed into the wider structural shifts already underway in export-oriented apparel manufacturing GVCs, resulting in shorter value chains (see Chapter 3). As countries continue to battle to contain the spread of COVID-19, a wider garment sector recovery may be some way off, with a lag before garment production and demand for apparel returns to pre-pandemic levels. In the meantime, further support for garment manufacturers and workers will be necessary.
Commodities constitute around one-third of world merchandise exports and approximately 20 per cent of these exports originate from Commonwealth countries. Commodities are also a key component of the Commonwealth's overall merchandise exports, accounting for 45 per cent of these exports (higher than the world average of 33 per cent). Many developed and developing Commonwealth countries are heavily dependent on commodities exports - 31 members derive more than 80 per cent of their merchandise export earnings from primary commodities. The shares of commodities in the exports of New Zealand and Australia are above 70 per cent; they are even higher for the Pacific SIDS (97 per cent) and SSA countries (79 per cent). COVID-related restrictions have led to a sharp decline in commodity prices, adversely affecting the exports of many developed and developing countries (Box 1.6).
Box 1.6 Commodities exports and COVID-19
Commonwealth countries' main commodity exports are food products, mineral ores, metals and fuels. Among these, fuels are the largest exported item, constituting around 42 per cent of all commodities exports. This is followed by mineral ores (36 per cent) and agri-food products (22 per cent).
Around 55 per cent of these exports are destined for five markets: China, the USA, the EU-27, the UK and Australia. The COVID-19 pandemic has negatively affected demand for commodities in these key markets, leading to a collapse in commodity prices, particularly for fuels. Prices of other key commodities, such as agricultural products and mineral ores, have been relatively less affected. Nevertheless, the reduction in demand, along with challenges associated with production and exporting, led to an aggregate export loss of around US$125 billion for Commonwealth countries in 2020. This represents a decline of 24 per cent compared with the pre-pandemic trend. The Commonwealth's commodity exports to the USA were hit the hardest (falling by $50 billion) followed by those to the EU-27 ($41 billion) and China ($26 billion); notably, in a diplomatic dispute since Canberra's call for an international investigation into the origins of COVID-19, Australian imports have encountered difficulties entering the Chinese market, including timber, barley, beef and some types of coal (see Chapter 4). Exports to the UK were $400 million below the estimate for a "business-as-usual" situation.
In value terms, Commonwealth developed countries experienced a large drop in commodities exports, amounting to US$57 billion, driven mainly by a fall in exports from Australia (see above) and Canada. In absolute terms, Asian Commonwealth members were the second most affected group, closely followed by African members. However, in relative terms, Caribbean members were hit more severely. Their commodities exports dropped by 60 per cent compared with the historical average. This owed mainly to sharp declines in exports of crude and refined oil as well as of natural gases from Trinidad and Tobago and, to a lesser extent, exports of sugar and crustaceans from Belize, mainly to the EU-27. Overall, the Pacific region was the least affected.
The prices of most commodities surged in the second half of 2020, offsetting some of the trade losses in commodity-dependent economies (Figure 1.22). Resumption of transport activities is pushing up oil prices, which traded at US$66 per barrel in the first week of March 2021. Similarly, the on-going transition towards electric and hybrid vehicles is incentivising demand for minerals used to manufacture batteries and chips. There is the possibility of a new commodity super cycle, which could support a relatively fast recovery in commodities trade for Commonwealth countries (The Economist, 2021a).
Figure 1.22 Monthly variation in commodity price indices in 2020
Source: Commonwealth Secretariat (calulated using data from UNCTADstat dataset)
1.4.2 COVID-19 and services trade
Services account for at least half of total economic activity in terms of GDP in Commonwealth members. Levels are particularly high in high-income countries but also in some SIDS, where activities like tourism and finance - both services - are important in the overall economy (Shepherd and Shingal, 2021). The pandemic has had significant impacts on the services sector. While all Commonwealth countries have been subject to shocks related to COVID-19, extents and recovery paths have varied substantially (Box 1.7).
Box 1.7 Drop in services exports during the COVID-19 pandemic
Analysis of monthly services exports for eight Commonwealth countries from January to December 2020 provides some indication of the immediate and direct effects of the COVID-19 pandemic on services trade. Most countries reporting high frequency data have seen major reductions to services exports starting from January 2020 when compared with the corresponding months during 2019. The extent of the decline is striking. Services exports from Tanzania and Uganda have collapsed by over 60 per cent while those of Australia and Kenya have dipped by around 40 per cent (see Figure 1.23).
Figure 1.23
COVID-19 impact on services exports of selected Commonwealth countries, 2020 vs. 2019
Note: The chart presents percentage change in exports in 2020 compared with the corresponding month in 2019 for selected Commonwealth countries that report monthly services export data to the WTO. Source: Commonwealth Secretariat (calculated using data from the WTO)
These economic shocks are massive, and the pace of recovery varies by country. The services exports of India and Malta have rebounded to a great extent, but those of Uganda in December 2020 were almost half the level recorded in December 2019. Similarly, Australia's services exports were about 60 per cent of December 2019 levels, while those of the UK were about three-quarters of the levels observed in the corresponding months of 2019. Whereas services exported by Uganda and Tanzania have declined significantly and have not yet recovered, by September 2020 Pakistan's services exports had already rebounded to December 2019 levels (despite falling by 20 per cent in April 2020).
There is no clear pattern according to development level, although sectoral specialisations have influenced the nature of impacts. Economies that are highly dependent on services trade that requires in-person interactions, such as tourism, have seen steep and sustained declines in their exports (Kenya, Uganda), while those exporting ICT-related services have performed better (India, Pakistan). The services exports of Caribbean countries, as well as those of the Pacific islands, which largely rely on travel and tourism-related services, were down by around 70 per cent in 2020 (WTO, 2020a).12
COVID-19 and substituting modes of supply
Services exports contribute 35 per cent of intra-Commonwealth trade, which is significantly higher than the share of services in world trade (25 per cent). Commonwealth members with large tourism and travel sectors, especially the 25 SIDS, have been hard hit, as the global tourist economy has contracted substantially.
This has adversely affected women workers (Box 1.8). As employment for women increases globally, there has also been a corresponding shift into service sectors. An estimated 43 per cent of women across the Commonwealth were employed in the services sector in 2019, up from 30 per cent in 2000. In developed countries, over 90 per cent of women work in the services sector, an increase of 5 percentage points from 2000. In developing countries, 36 per cent of employed women work in services sectors, an increase of 16 percentage points since 2000. New trends in global trade, particularly the rise in services, GVCs and the digital economy, now offer more economic opportunities to women.
Transport and travel constitute around half of intra-Commonwealth services exports. Air travel has been significantly affected by border closures and international travel restrictions. The International Air Transport Association has projected US$126 billion in losses for 2020, marking the worst annual financial result in aviation history, with smaller losses of $47.7 billion in 2021 (IATA, 2021). Airlines of several Commonwealth countries, including Antigua and Barbuda, Australia, Canada, India, Namibia, South Africa and the UK, have entered bankruptcy protection/administration or been liquidated since the start of the pandemic. Some of the bigger airlines are expected to survive following restructurings and a rebound in demand. Aside from the direct effects on intra-Commonwealth travel and tourism-related services exports, the collapse in global aviation also impacted some goods trade, especially passenger-based air freight services that deliver high value exports (e.g. East African horticulture and floriculture direct to the UK).
Box 1.8 Entrepreneurship, trade and women's economic empowerment
Across the Commonwealth, women make up approximately 50 per cent of the population and 30 per cent of the labour force. However, compared with men, women contribute less to global GDP and significantly less to international trade. Despite 122 World Trade Organization (WTO) members and observers, including 31 Commonwealth countries, endorsing the 2017 Joint Declaration on Trade and Women's Economic Empowerment, women remain under-represented in trade. In one estimate, only 15 per cent of exporting firms are led by women (ITC, 2015). Factors such as a higher share of unpaid or underpaid work at home and in the informal sector, as well as barriers to entry for entrepreneurship and trade, limit women's participation.
Women-owned businesses have been disproportionately impacted by the pandemic. This is because they are over-represented in high-risk sectors such as tourism, transport and travel, retail, food services, accommodation, entertainment and recreation, and manufacturing across economies of all income categories. Despite the pandemic's adverse impact, some women business owners are adjusting to the new reality. According to the 2020 Mastercard Index of Women in Entrepreneurship Report, 42 per cent of women-owned businesses have shifted to a digital business model, 37 per cent are developing an area of business to meet local or global needs and 34 per cent have identified new business opportunities since the pandemic.
As employment for women increases globally, there has also been a corresponding shift into service sectors. An estimated 43 per cent of women across the Commonwealth were employed in the services sector in 2019, up from 30 per cent in 2000. In developed countries, over 90 per cent of women work in the services sector, an increase of 5 percentage points from 2000. In developing countries, 36 per cent of employed women work in services sectors, an increase of 16 percentage points since 2000. New trends in global trade, particularly the rise in services, GVCs and the digital economy, now offer more economic opportunities to women.
However, fewer women are engaged in tradeable services than men. For Commonwealth countries, on average, 5 per cent of women are engaged in tradeable service sectors compared with 18 per cent of men (calculated as the share of total employment). This varies across regions, with women in developed countries engaged in an estimated 16 per cent of tradeable services, followed by Caribbean SIDS with 15 per cent. Asian countries fall short with less than 30 per cent of women represented in overall employment, less than 5 per cent of whom are engaged in tradeable services.
Women face various challenges in taking advantage of the new opportunities for greater inclusion and empowerment. For example, they face greater non-tariff measures such as access to financing to facilitate their participation in trade. For example, female-led formal SMEs face a credit gap of roughly US$300 billion (Gonzalez, 2017). They also face cultural barriers as well as time and skills constraints.
Given these challenges, there is a need for greater effort to advance women's participation in tradeable services and other areas of international trade. Policy-makers must strive to reduce trade barriers, promote and support women-led businesses and give equal opportunities for them to access credit and trade finance. In addition to mainstreaming gender issues in trade agreements, greater consideration should be given to fully implementing the Trade Facilitation Agreement, training women to access market opportunities and connecting women to these opportunities. The International Trade Centre (ITC) SheTrades initiative, supported by the Commonwealth Secretariat, can be used to provide training for women entrepreneurs and women-owned businesses to increase their competitiveness and participation in trade. The initiative aims to connect 3 million women to market by 2021 and has so far been utilised by four Commonwealth countries, Bangladesh, Kenya, Ghana and Nigeria, under its Commonwealth chapter.
The pandemic has affected how services are traded, with some suppliers increasingly using digital means to deliver across borders, as discussed in the next chapter. Generally, there are four modes of supply for services trade, as recognised by the General Agreement on Trade in Services (GATS) of the World Trade Organization (WTO). They are:
Mode 1 - cross-border supply using postal services or ICT; this includes digitally deliverable services (DDS), as discussed in Chapter 2
Mode 2 - consumption abroad by consumers
Mode 3 - commercial presence through branches or subsidiaries abroad
Mode 4 - temporary movement of persons to deliver a service in another country
Modes 2 and 4, which directly involve movement of persons, account for around 14 per cent of the value of Commonwealth exports. The largest aggregate, however, is Mode 3 sales by foreign affiliates. Finally, Mode 1 accounts for 35 per cent of the value of Commonwealth services exports (Figure 1.24). While there is substantial evidence of a shift towards increased Mode 1 trade, including DDS, through online interactions, the ability to trade in this way is dependent on infrastructure, technological capacity, human capital and connectivity (Shepherd and Shingal, 2021). This is not always an option for service providers in many developing countries and LDCs, as discussed in Chapters 2 and 5.
Figure 1.24
Potential COVID-19 pandemic effects on services trade
Source: Commonwealth Secretariat (calculated using WTO TiSMoS dataset for 2017)
The shocks of the pandemic have clear implications for the Commonwealth's services trade via Modes 2 and 4. In the case of Mode 2, it is consumers whose movements are impeded, with a corresponding reduction in trade, including exports of tourism, health and education services (Box 1.9). For Mode 4 it is service suppliers, again with a consequent reduction in trade. The case of Mode 3 is more ambiguous. The investment transactions at the base of Mode 3 can, in principle, take place without in-person interactions, although they have traditionally been an important part of large-scale investment decisions. To the extent that in-person interactions have become less desirable or less feasible, one effect may be to reduce the sales of foreign-owned firms in sectors where such interactions are important.13
Given the unprecedented scale and scope of the pandemic, it seems highly likely that trade has been reduced for Modes 2 and 4 but also potentially for Mode 3 (Shepherd and Shingal, 2021). However, the case of Mode 1 is quite different. This involves trade in services taking place through online means, subject to having access to the necessary infrastructure and services. As such, in some sectors, there is a countervailing force in the direction of increased services trade in Mode 1 specifically, as substitution across modes takes place in response to the pandemic (ibid).
Box 1.9 Switching modes? COVID-19 and the education services exports of Australia and Canada
The international education sector is important for Australia and Canada, and their universities draw students from around the world. In particular, Australia draws students from countries in East and Southeast Asia and Canada from Commonwealth partners, especially India.
Education services are Australia's third-largest export (AU$18.8 billion in 2014/15) and indirectly support 1.3 per cent of the country's total employment. In Canada, the sector accounts for just over 1.2 per cent of total services exports, which reflects Canada's relatively diversified economy. In both countries, especially Australia, Mode 2 accounts almost entirely for the delivery of education services. When the pandemic hit, Australia and Canada adopted extensive travel restrictions, with obvious implications for foreign students seeking entry for study purposes. Given the difficulty of safely ensuring in-person interactions, both countries transitioned to online learning for students inside the country - and via Mode 1 trade for those outside.
A notable difference between the two countries relates to the way in which travel restrictions have affected international students. In Australia, inward movements of non-Australian citizens were reduced to close to zero, with no special exemption for students. Once the extent of the disruption to the sector was clearer, including the possibility of halving the foreign student population, the federal government made changes to student visa rules to facilitate post-study work for students already in Australia, as well as rapidly allowing entry by new and returning students outside the country.
Canada, by contrast, continued to allow entry to registered students provided that their institution had an approved COVID-19 readiness plan. Partly because of this approach, industry estimates suggest that Canada's universities may see only a modest decline in revenue owing to the pandemic.
In both cases, there is an on-going question as to the level of future international student arrivals, assuming that travel restrictions are eased further. Another open question is whether the sector will transition durably to greater use of online platforms, which could potentially see some shift from a nearly exclusive reliance on Mode 2 trade to increased reliance on Mode 1 trade, especially as consumer and travel preferences change. There is no concrete indication yet that such a shift is taking place in more than a temporary way because of pandemic-related travel restrictions.
The global recession has severely damaged the already fragile economies of LDCs by drastically reducing external demand for their goods and services, lowering prices of key exports and constraining inflows of investment and other resources. These economies generally lack the resilience to withstand these multiple economic shocks, owing to their limited productive capabilities and lack of diversification. Consequently, the fallout from the pandemic threatens to stall, or even reverse, developmental progress made by Commonwealth LDCs and may undermine their prospects for graduating out of the LDC category (see Chapter 5).
While the pandemic has set back the trade and development prospects of LDCs, they were already off track from the target to double their share of world exports by 2020, as envisaged by the Istanbul Programme of Action (IPOA) for LDCs for 2011-2020 and adopted through the Sustainable Development Goals (SDGs) (see Chapter 5). This implied increasing the LDC share of global exports to 2 per cent, from one per cent at the start of IPOA implementation.
LDCs' global exports of goods and services rose from US$215 billion in 2011 to just over $243 billion in 2019. The exports of the 14 Commonwealth LDCs expanded from $56 billion to $79 billion (Annex 1.5). Despite some significant export growth in absolute terms over this period, the share of all LDCs in world merchandise trade stagnated just below 1 per cent, in both 2011 and 2019, although the dollar value of their exports in 2019 was the highest since 2000, at just over $243 billion. External shocks, including structural and cyclical factors and natural disasters in the Pacific and Southern Africa regions, also contributed to missing the target.
The trade performance of Commonwealth LDCs during this period was more robust than that of the other LDCs, with their exports growing from US$22 billion in 2005 to around $79 billion in 2019, almost fourfold. This reflects the significant contribution of intra-Commonwealth trade for many LDCs, especially in Asia and Africa. The share of Commonwealth LDCs in intra-Commonwealth trade in 2011 was 1.92 per cent - almost twice the corresponding share of all LDCs in world trade (Figure 1.25). During 2011-2019, the share of all LDCs in world trade stagnated, whereas that of the Commonwealth LDCs in intra-Commonwealth trade increased to 2.83 per cent over this period. Similarly, the share of Commonwealth LDCs in global trade also increased, from 0.25 per cent in 2011 to 0.32 per cent in 2019. A substantial portion of this increase is attributed to the export performance of Bangladesh, whose global exports almost doubled from $26 billion in 2011 to above $45 billion 2019.
Figure 1.25 Trade performance of LDCs during Istanbul Programme of Action
Note: The chart compares all LDCs' export share in world trade and 14 Commonwealth LDCs' share in world and intra-Commonwealth trade (goods and services combined) in 2011 and 2019. Source: Commonwealth Secretariat (calculated using UNCTADstat and OECD-WTO BaTIS datasets)
A protracted pandemic poses a significant risk to sustainable graduation pathways for LDCs. Twelve LDCs are expected to graduate within the next four years. Vanuatu graduated in December 2020 and two more Commonwealth LDCs - Solomon Islands and Bangladesh - are set to follow in 2024 and 2026, respectively.
1.6 Commonwealth trade prospects towards 2022
The 2015 Commonwealth Trade Review estimated that the value of intra-Commonwealth exports of goods and services would exceed US$700 billion in 2020. However, the slowdown in the Indian economy, uncertainty around Brexit negotiations and the spill-over effects of the USA-China trade and technology conflict, among other factors, contributed to lower growth in global and intra-Commonwealth trade in 2019.
Nevertheless, intra-Commonwealth exports are expected to rebound and reach 2019 levels by the end of 2021, and surpass US$700 billion by 2022. Similarly, Commonwealth countries' global exports are expected to reach $3.76 trillion in 2021. At this rate, the 2019 level for global exports ($3.73 trillion) could be also surpassed by 2021 (Figure 1.26).
Figure 1.26 Commonwealth's trade prospects in the short to medium term, 2019-2022
Source: Commonwealth Secretariat (calculated using UNCTADstat and OECD-WTO BaTIS dataset based on growth forecasts of the World Bank and IMF for individual economies)
The long-term average growth rate of the Commonwealth's global exports of goods and services in the post-global financial crisis period from 2010 to 2019 was around 5 per cent. If this trend continues, the value of the Commonwealth's global trade is projected to surpass US$5 trillion by 2025 and $6 trillion by 2030.14
The slow start and increasing uncertainties about the rollout of vaccines globally and in the Commonwealth means prospects of economic recovery could vary significantly across regions and countries. The entire populations of several Commonwealth member countries might not be vaccinated until 2023 or early 2024 (The Economist, 2021b; Vickers et al., 2021). Asian Commonwealth countries could rebound quickly and reach very close to pre-pandemic levels in 2021, while the recovery in LDCs and small states could be protracted. The lingering effects of the pandemic, in terms of slow human and physical capital formation, reduced investments and a slow revival of trade and transport-related services, will affect the recovery of exports in LDCs and small states, including SIDS.
The demography of Commonwealth countries could also influence the recovery. Prospects are generally more optimistic in countries with youthful populations - for example Asian and African members (Sneader and Singhal, 2021). Overall, more than half of the Commonwealth's combined population are below the age of 25. In many countries, the youth are more tech-savvy and innovative and the crisis has sparked an upsurge in innovation and tech start-ups.
It is a promising signal that the sensitivity of economic activities to COVID-19 restrictions has diminished significantly since the first lockdowns imposed in many Commonwealth countries. Three main factors-less public fear, better-calibrated government policy and adaptation by businesses-explain the greater resilience of economic activities during the second and third lockdowns. Improvements in several high-frequency economic indicators, including domestic travel, shipping demand, consumer spending, commodity prices and purchasing managers index, suggest trade flows could recover soon. However, in the short term, any recovery in trade in goods and services flows may not be sufficient to return to pre-pandemic trends, as the knock-on effects on physical and human capital, and the direct and indirect effects of the pandemic on innovation and investment, could continue to hamper trade flows for several years. Moreover, while merchandise trade had gained momentum by the end of 2020, exports in services sectors requiring in-person interaction - for example hospitality, tourism and education - are still struggling to adapt to these new realities.
The relatively greater resilience of intra-Commonwealth trade flows to the pre-pandemic headwinds, as well as their quick rebound after the global financial crisis (2008/09) and the more recent trade slowdown in 2015/16, offers another silver lining. Although the growth of intra-Commonwealth trade (0.5 per cent) and the Commonwealth's world trade (0.2 per cent) in 2019 were limited, both compared favourably with growth in world trade, which declined by 1 per cent.
1.7 Conclusion and way forward
This chapter has demonstrated how COVID-19 has adversely affected the goods and services exports of all Commonwealth countries, although these impacts vary by regions and sectors. Considering the monetary and fiscal support measures being implemented by several countries, and progress in rolling out vaccinations, 2021 is likely to be a year of transition, and there is a cautious optimism about the Commonwealth's trade prospects. World trade is expected to rebound by 8.4 per cent in 2021 and 6.5 per cent in 2022 (IMF, 2021a). Merchandise trade is leading the recovery; the services sector, especially transportation, travel and tourism, may take longer to reach pre-pandemic levels of activity.
Like previous economic downturns, a return of consumer confidence could increase spending as pent-up demand is unleashed, thereby incentivising growth in production and trade (Sneader and Singhal, 2021). It is reported that consumers in 21 rich economies have accumulated around US$3 trillion in excess savings (The Economist, 2021c). Spending of this magnitude would create a demand spill-over to power a strong recovery.
Despite these promising tailwinds for recovery, the impact of this unprecedented global crisis, together with the unresolved USA-China trade conflict, create a more challenging outlook for the Commonwealth's long-term vision of growing intra-Commonwealth trade to US$2 trillion by 2030. Commonwealth policy-makers, parliamentarians and businesses need to consider more concerted policy actions to expedite the recovery process and ensure it is inclusive and sustainable.
Although the Commonwealth is not a trading bloc, countries can look to harness the Commonwealth advantage to boost intra-Commonwealth trade and help get past the pandemic. As has been demonstrated, the Commonwealth advantage remains strong, resilient and compelling, and leads to lower bilateral trade costs of 21 per cent, on average. Members can also strengthen co-operation and share best practices and experiences regarding trade policy and domestic reform through the Commonwealth Connectivity Agenda. Members have adopted an Action Plan to guide discussions and work in five inclusive clusters concerning physical, digital, supply side, regulatory and business-to-business connectivity. The Commonwealth as a platform for establishing and strengthening contacts between traders and investors, as well as its large and dynamic diaspora, should be enhanced and effectively utilised.15 In future, trade fairs could be linked to the biennial Heads of Government meetings.
Second, revitalising the services sector will be a boon for trade recovery and improved development prospects in the Commonwealth. Countries should identify practical ways to benefit from the rising servicification trend in most Commonwealth countries and the relatively large share of services in intra-Commonwealth exports (around one-third), including as suppliers of services tasks, which are increasingly ICT-enabled, in GVCs. Unlike the previous trade collapse in 2008/09, which primarily affected merchandise trade, this crisis has had a relatively bigger effect on the services sector, because of the restrictions on physical interaction between consumers and suppliers. Digitalisation has enabled the online delivery of many services, although this switching of modes does not compensate for the pandemic's losses. The recovery in key services sectors, especially the travel and tourism services that underpin many small states' economies, largely depends on the performance of the health sector and progress with vaccinations. Chapter 5 discusses the recovery of the tourism sector in greater detail.
Third, since most intra-Commonwealth trade takes place regionally, it is imperative to strengthen and implement existing regional trade agreements (RTAs) and those struck in recent years, including the African Continental Free Trade Area and the signed Regional Comprehensive Economic Partnership in Asia-Pacific, as discussed in Chapter 4. In addition, several Commonwealth developed countries, as well as other developed and some developing countries globally, including the USA, the EU and China, offer tariff preferences to LDCs. There is scope to extend these to include services under an agreed waiver at the WTO. However, as discussed in Chapter 5, it is necessary to build institutional mechanisms and key stakeholder partnerships as well as supply side capacity in LDCs to utilise these preferences. Finally, digital trade and digitalisation also open new and promising opportunities for Commonwealth countries to grow their trade in an expanding range of digitisable or digitally deliverable products, services and e-commerce. This digital transformation of goods and services trade is explored next, in Chapter 2.
Annex 1.1 Commonwealth export profile, 2019
Global (US$ million)
Intra-Commonwealth (US$ million)
Intra-Commonwealth (%)
Share of goods & services (%)
Share in Commonwealth exports (%)
Goods
Services
Goods and services
Goods
Services
Goods and services
Goods
Services
Goods and services
Goods
Services
Goods
Services
Commonwealth
2,538,222
1,187,637
3,725,859
433,892
238,755
672,647
17.31
20.10
18.21
64.51
35.49
100.00
100.00
Developed
1,226,923
634,385
1,861,307
125,026
93,587
218,613
10.19
14.75
11.75
57.19
42.81
48.96
53.42
Australia
266,377
69,975
336,352
48,627
23,221
71,847
18.25
33.18
21.36
67.68
32.32
10.63
5.89
Canada
446,148
100,342
546,491
26,579
11,955
38,535
5.96
11.91
7.05
68.98
31.02
17.80
8.45
Cyprusb
3,528
13,808
17,337
446
3,941
4,386
12.63
28.54
25.30
10.16
89.84
0.14
1.16
Maltab
3,007
17,081
20,088
348
4,351
4,699
11.56
25.47
23.39
7.40
92.60
0.12
1.44
New Zealand
39,540
16,870
56,410
10,712
7,051
17,763
27.09
41.79
31.49
60.31
39.69
1.58
1.42
United Kingdom
468,322
416,307
884,630
38,315
43,068
81,383
8.18
10.35
9.20
47.08
52.92
18.69
35.05
Developing
1,279,272
553,253
1,832,524
308,866
145,168
454,034
24.14
26.24
24.78
68.03
31.97
51.04
46.58
Africa
219,463
51,680
271,143
75,815
13,539
89,354
34.55
26.20
32.95
84.85
15.15
8.76
4.35
Botswanab
5,238
886
6,124
1,914
234
2,148
36.54
26.43
35.08
89.10
10.90
0.21
0.07
Cameroon
4,487
2,397
6,884
711
452
1,163
15.84
18.85
16.89
61.14
38.86
0.18
0.20
Eswatinib
2,002
89
2,090
1,723
34
1,757
86.09
37.74
84.04
98.09
1.91
0.08
0.01
The Gambiabc
133
229
362
39
60
99
29.09
26.06
27.17
39.36
60.64
0.01
0.02
Ghana
16,768
8,756
25,524
4,769
2,344
7,113
28.44
26.78
27.87
67.04
32.96
0.67
0.74
Kenya
5,838
5,389
11,227
2,513
1,497
4,009
43.04
27.78
35.71
62.67
37.33
0.23
0.45
Lesothobc
1,014
31
1,045
386
7
394
38.09
23.81
37.67
98.15
1.85
0.04
0.00
Malawic
859
179
1,038
215
47
262
25.03
26.24
25.24
82.08
17.92
0.03
0.02
Mauritiusab
2,230
2,949
5,179
624
889
1,513
27.99
30.13
29.21
41.26
58.74
0.09
0.25
Mozambiquec
4,716
923
5,639
2,009
214
2,223
42.61
23.15
39.42
90.39
9.61
0.19
0.08
Namibiab
4,949
650
5,599
1,922
181
2,103
38.83
27.92
37.56
91.37
8.63
0.20
0.05
Nigeria
64,445
4,948
69,393
22,760
1,164
23,924
35.32
23.52
34.48
95.14
4.86
2.57
0.42
Rwandac
1,162
992
2,153
138
225
363
11.87
22.73
16.87
37.97
62.03
0.05
0.08
Seychellesab
518
1,123
1,641
155
342
496
29.86
30.40
30.23
31.16
68.84
0.02
0.09
Sierra Leonec
661
251
912
55
50
105
8.25
20.09
11.50
52.00
48.00
0.03
0.02
South Africa
89,396
14,727
104,123
31,474
4,050
35,524
35.21
27.50
34.12
88.60
11.40
3.57
1.24
Tanzaniac
4,544
4,119
8,663
1,811
914
2,724
39.85
22.18
31.45
66.46
33.54
0.18
0.35
Ugandac
3,472
2,029
5,501
681
470
1,151
19.61
23.18
20.93
59.15
40.85
0.14
0.17
Zambiac
7,029
1,014
8,043
1,917
366
2,283
27.28
36.06
28.39
83.99
16.01
0.28
0.09
Asia
1,033,714
483,121
1,516,835
225,386
127,067
352,452
21.80
26.30
23.24
63.95
36.05
41.25
40.68
Bangladeshc
38,554
6,128
44,683
7,442
1,704
9,146
19.30
27.80
20.47
81.37
18.63
1.54
0.52
Brunei Darussalambc
7,039
618
7,657
2,239
159
2,399
31.81
25.80
31.33
93.35
6.65
0.28
0.05
India
323,251
214,365
537,615
63,959
50,008
113,966
19.79
23.33
21.20
56.12
43.88
12.90
18.05
Malaysia
238,089
40,883
278,972
61,232
17,164
78,395
25.72
41.98
28.10
78.11
21.89
9.50
3.44
Maldivesab
361
3,421
3,781
136
691
827
37.72
20.20
21.87
16.45
83.55
0.01
0.29
Pakistan
23,749
5,418
29,167
4,576
664
5,241
19.27
12.26
17.97
87.32
12.68
0.95
0.46
Singapore
390,332
204,814
595,145
82,937
54,811
137,748
21.25
26.76
23.15
60.21
39.79
15.57
17.25
Sri Lanka
12,340
7,474
19,814
2,865
1,865
4,731
23.22
24.96
23.87
60.57
39.43
0.49
0.63
Caribbean
13,074
15,558
28,632
2,737
3,559
6,296
20.94
22.88
21.99
43.48
56.52
0.52
1.31
Antigua and Barbudaab
37
1,157
1,194
14
244
258
38.36
21.07
21.61
5.56
94.44
0.00
0.10
The Bahamasab
654
4,094
4,747
97
803
900
14.81
19.62
18.96
10.76
89.24
0.03
0.34
Barbadosab
454
1,503
1,957
209
371
581
46.16
24.71
29.68
36.07
63.93
0.02
0.13
Belizeab
462
686
1,148
154
192
346
33.41
27.94
30.14
44.62
55.38
0.02
0.06
Dominicaab
20
148
168
16
35
51
80.62
23.91
30.60
31.09
68.91
0.00
0.01
Grenadaab
32
650
682
15
156
171
47.15
24.02
25.10
8.73
91.27
0.00
0.05
Guyanaab
1,693
231
1,924
674
66
740
39.82
28.44
38.45
91.10
8.90
0.07
0.02
Jamaicaab
1,586
4,336
5,922
315
1,008
1,323
19.84
23.25
22.34
23.79
76.21
0.06
0.37
St Kitts and Nevisab
63
587
650
26
95
121
40.56
16.23
18.58
21.14
78.86
0.00
0.05
Saint Luciaab
55
1,103
1,158
20
327
347
35.53
29.66
29.94
5.64
94.36
0.00
0.09
St Vincent and the Grenadinesab
38
291
330
8
80
88
21.59
27.51
26.83
9.33
90.67
0.00
0.02
Trinidad and Tobagoab
7,981
772
8,752
1,189
181
1,370
14.90
23.44
15.66
86.80
13.20
0.32
0.06
Pacific
13,021
2,894
15,915
4,927
1,003
5,931
37.84
34.67
37.27
83.08
16.92
0.52
0.24
Fijiab
1,031
1,613
2,644
427
578
1,005
41.37
35.85
38.00
42.46
57.54
0.04
0.14
Kiribatiabc
13
11
24
1
1
2
6.46
13.66
9.68
36.92
63.08
0.00
0.00
Nauruab
34
34
7
7
20.48
20.48
-
0.00
0.00
Papua New Guineaab
11,369
266
11,635
4,397
109
4,506
38.67
41.16
38.73
97.57
2.43
0.45
0.02
Samoaab
49
294
343
16
107
123
33.18
36.39
35.93
13.19
86.81
0.00
0.02
Solomon Islandsabc
461
128
589
50
32
82
10.87
24.72
13.88
61.35
38.65
0.02
0.01
Tongaab
20
88
108
8
19
26
38.84
21.16
24.46
29.63
70.37
0.00
0.01
Tuvaluabc
0.1
6
6
0
1
1
7.30
18.11
17.92
0.71
99.29
0.00
0.00
Vanuatuabc
43
489
533
22
156
178
50.42
31.92
33.43
12.31
87.69
0.00
0.04
Vulnerable groups
Small states
60,602
61,734
122,335
18,307
15,903
34,210
30.21
25.76
27.96
53.51
46.49
2.42
5.20
SIDS
29,204
25,945
55,149
8,580
6,484
15,063
29.38
24.99
27.31
56.96
43.04
1.17
2.18
LDCs
62,663
16,528
79,192
14,766
4,247
19,013
23.56
25.70
24.01
77.66
22.34
2.50
1.39
Note:a represents 24 Commonwealth Small Island Developing States (SIDSs) and excludes Singapore; b represents 32 Commonwealth Small states; c represents 14 Least Developed Countries (LDCs).
Source: Commonwealth Secretariat (calculated using UNCTADstat and OECD-WTO BaTIS datasets)
Annex 1.2 COVID-19 impact on the GDP of Commonwealth economies, 2019-2022 (constant 2010 US$ million)
Pre-COVID
In-COVID
GDP loss (%)
2019
2020e
2021f
2022f
2020e
2021f
2022f
2020e
2021f
2022f
Commonwealth
12,185,299
12,577,083
13,008,051
13,468,053
11,422,516
12,172,844
12,776,570
-10.11
-6.86
-5.41
Developed
6,546,100
6,662,007
6,787,217
6,914,590
6,107,937
6,414,311
6,693,193
-9.07
-5.81
-3.31
Australia
1,450,499
1,483,324
1,521,623
1,562,692
1,415,136
1,479,355
1,520,067
-4.82
-2.86
-2.80
Canada
1,939,183
1,973,332
2,007,984
2,042,501
1,834,409
1,926,955
2,016,617
-7.57
-4.21
-1.28
Cyprus
28,678
29,506
30,306
31,095
27,214
28,035
29,128
-8.42
-8.10
-6.76
Malta
14,565
15,193
15,762
16,314
13,545
14,177
14,967
-12.17
-11.18
-9.00
New Zealand
191,728
196,903
202,062
207,306
185,994
193,515
199,698
-5.87
-4.42
-3.81
United Kingdom
2,921,446
2,963,749
3,009,479
3,054,682
2,631,639
2,772,273
2,912,717
-12.62
-8.56
-4.87
Developing
5,639,198
5,915,076
6,220,834
6,553,463
5,314,579
5,758,533
6,083,377
-11.30
-8.03
-7.73
Africa
1,298,056
1,333,207
1,370,730
1,411,695
1,252,122
1,293,671
1,332,370
-6.48
-5.96
-5.95
Botswana
18,644
19,430
20,412
21,234
17,106
18,389
19,383
-13.59
-11.00
-9.55
Cameroon
39,288
40,932
42,735
44,757
38,201
39,513
41,214
-7.15
-8.15
-8.60
Eswatini
5,532
5,618
5,706
5,793
5,347
5,423
5,471
-5.07
-5.22
-5.88
The Gambia
1,914
2,035
2,151
2,269
1,914
2,029
2,161
-6.35
-6.05
-5.01
Ghana
57,316
60,871
63,739
66,676
57,820
60,503
64,196
-5.28
-5.35
-3.86
Kenya
65,060
68,979
72,985
77,233
64,978
69,890
73,895
-6.16
-4.43
-4.52
Lesotho
2,875
2,882
2,966
3,073
2,744
2,839
2,960
-5.04
-4.46
-3.82
Malawi
9,754
10,237
10,785
11,394
9,813
10,028
10,680
-4.32
-7.54
-6.68
Mauritius
13,787
14,320
14,887
15,484
11,608
12,375
13,018
-23.36
-20.31
-18.94
Mozambique
17,876
18,747
19,515
20,335
17,786
18,160
19,013
-5.40
-7.46
-6.95
Namibia
14,383
14,560
14,861
15,240
13,342
13,691
14,148
-9.13
-8.54
-7.71
Nigeria
477,162
488,187
499,454
511,518
468,602
480,471
491,556
-4.18
-3.95
-4.06
Rwanda
11,381
12,303
13,299
14,363
11,358
12,004
12,826
-8.32
-10.79
-11.99
Seychelles
1,469
1,518
1,574
1,633
1,273
1,296
1,351
-19.24
-21.48
-20.85
Sierra Leone
3,816
3,999
4,192
4,394
3,731
3,844
3,981
-7.19
-9.06
-10.38
South Africa
430,167
434,423
440,373
447,557
400,227
412,634
420,763
-8.54
-6.72
-6.37
Tanzania
55,482
58,673
62,220
66,107
56,053
57,543
60,199
-4.67
-8.13
-9.81
Uganda
42,611
45,320
48,049
50,946
41,715
44,362
46,576
-8.64
-8.31
-9.38
Zambia
29,539
30,173
30,826
31,690
28,506
28,677
28,979
-5.85
-7.50
-9.36
Asia
4,247,320
4,482,439
4,747,932
5,035,763
3,975,336
4,374,798
4,652,617
-12.76
-8.53
-8.24
Bangladesh
209,974
225,350
241,800
259,452
217,949
228,923
246,012
-3.40
-5.63
-5.46
Brunei Darussalam
14,007
14,666
15,193
15,730
14,175
14,409
14,775
-3.46
-5.44
-6.46
India
2,940,157
3,128,812
3,340,664
3,566,760
2,705,973
3,045,465
3,256,576
-15.63
-9.69
-9.52
Malaysia
398,947
416,700
436,285
456,659
376,653
401,136
425,204
-10.63
-8.76
-7.40
Maldives
4,501
4,760
5,025
5,303
3,050
3,625
4,110
-56.11
-38.62
-29.03
Pakistan
256,729
262,826
270,712
282,120
255,740
259,566
269,871
-2.77
-4.29
-4.54
Singapore
335,539
338,871
344,201
351,829
317,450
333,951
344,744
-6.75
-3.07
-2.05
Sri Lanka
87,467
90,455
94,052
97,910
84,345
87,724
91,324
-7.24
-7.21
-7.21
Caribbean SIDS
64,138
68,931
70,835
73,736
59,241
61,305
68,267
-16.36
-15.55
-8.01
Antigua and Barbuda
1,525
1,576
1,615
1,648
1,262
1,224
1,369
-24.90
-31.97
-20.32
Bahamas
11,259
11,197
11,432
11,630
9,426
9,615
10,432
-18.78
-18.90
-11.48
Barbados
4,621
4,649
4,719
4,805
3,808
3,964
4,269
-22.09
-19.04
-12.56
Belize
1,620
1,654
1,684
1,713
1,392
1,418
1,509
-18.84
-18.70
-13.52
Dominica
497
521
543
562
445
443
469
-17.17
-22.54
-19.91
Grenada
1,033
1,062
1,091
1,126
894
880
925
-18.81
-24.01
-21.69
Guyana
4,781
8,900
9,579
11,266
6,855
7,978
11,687
-29.83
-20.06
3.60
Jamaica
14,349
14,501
14,712
15,004
12,882
13,071
13,816
-12.57
-12.55
-8.60
St Kitts and Nevis
914
946
974
1,000
743
728
801
-27.23
-33.72
-24.85
Saint Lucia
1,709
1,764
1,817
1,861
1,387
1,431
1,584
-27.18
-27.00
-17.43
St Vincent and the Grenadines
759
776
795
813
727
727
763
-6.77
-9.35
-6.60
Trinidad and Tobago
21,071
21,386
21,876
22,308
19,421
19,826
20,642
-10.12
-10.34
-8.07
Pacific SIDS
29,685
30,499
31,336
32,269
27,879
28,759
30,123
-9.40
-8.96
-7.12
Fiji
4,217
4,316
4,448
4,586
3,416
3,587
3,909
-26.36
-24.01
-17.30
Kiribati
211
216
220
224
210
213
219
-2.84
-3.09
-2.52
Nauru
103
104
106
107
104
106
107
-0.03
0.25
-0.49
Papua New Guinea
21,852
22,449
23,058
23,755
21,005
21,734
22,656
-6.88
-6.09
-4.85
Samoa
763
796
814
832
739
681
693
-7.80
-19.48
-20.07
Solomon Islands
1,172
1,205
1,238
1,272
1,121
1,138
1,190
-7.48
-8.78
-6.91
Tonga
455
472
485
497
453
442
453
-4.17
-9.89
-9.81
Tuvalu
46
48
50
52
46
47
49
-3.83
-5.62
-6.26
Vanuatu
866
893
918
943
786
811
848
-13.59
-13.19
-11.26
Source: Commonwealth Secretariat (using data from the IMF Outlook, October 2019 and April 2021)
Annex 1.3 Immediate effect of COVID-19 on economic growth of Commonwealth countries, 2019 vs. 2020
Note: Pre-COVID estimates indicate IMF's growth projections made in October 2019 (before the onset of the pandemic) while in-COVID growth rates represent the actual growth figures released in April 2021. Guyana grew by 43 per cent in 2020 but is not included because it is an outlier on the chart. Source: Commonwealth Secretariat (using data from the IMF World Economic Outlook, October 2019 and April 2021)
Annex 1.4 Orientation of merchandise trade flows towards Commonwealth countries, 2005 vs. 2019
Source: Commonwealth Secretariat (calculated using UNCTADstat dataset)
Annex 1.5 Commonwealth LDCs global and intra-Commonwealth export profile, 2019
Group/region
Global exports
Intra-Commonwealth exports
Reliance on Commonwealth market (%)
Value (US$ million)
Share (%)
Value (US$ million)
Share (%)
Goods
Services
Goods and services
Goods
Services
Goods
Services
Goods and services
Goods
Services
Goods
Services
Goods and services
Commonwealth total
2,538, 222
1,187,637
3,725,859
67.3
31.9
433,892
238,755
672,647
64.5
35.5
17.3
201
18.1
LDCs total
62,663
16,528
79,192
79.1
20.9
14,766
4,247
19,013
77.7
22.3
23.6
25.7
24.0
Of which
Africa
23,591
9,766
33,357
70.7
29.3
7,251
2,353
9,604
75.5
24.5
30.7
24.1
28.8
The Gambia
133
229
362
36.8
63.2
39
60
99
39.4
60.6
29.1
26.1
27.2
Lesotho
1,014
31
1,045
97.1
2.9
386
7
394
98.1
1.9
38.1
23.8
37.7
Malawi
859
179
1,038
82.8
17.2
215
47
262
82.1
17.9
25.0
26.2
25.2
Mozambique
4,716
923
5,639
83.6
16.4
2,009
214
2,223
90.4
9.6
42.6
23.1
39.4
Rwanda
1,162
992
2,153
54.0
46.0
138
225
363
38.0
62.0
11.9
22.7
16.9
Sierra Leone
661
251
912
72.5
27.5
55
50
105
52.0
48.0
8.3
20.1
11.5
Tanzania
4,544
4,119
8,663
52.4
47.6
1,811
914
2,724
66.5
33.5
39.8
22.2
31.4
Uganda
3,472
2,029
5,501
63.1
36.9
681
470
1,151
59.2
40.8
19.6
23.2
20.9
Zambia
7,029
1,014
8,043
87.4
12.6
1,917
366
2,283
84.0
16.0
27.3
36.1
28.4
Asia (Bangladesh)
38,554
6,128
44,683
86.3
13.7
7,442
1,704
9,146
81.4
18.6
19.3
27.8
20.5
Pacific
518
634
1,151
45.0
55.0
73
190
263
27.7
72.3
14.1
30.0
22.9
Kiribati
13
11
24
55.3
44.7
0.8
1.4
2.3
36.9
63.1
6.5
13.7
9.7
Solomon Islands
461
128
589
78.3
21.7
50.1
31.6
81.7
61.4
38.6
10.9
24.7
13.9
Tuvalu
0
6
6
1.7
98.3
0.0
1.1
1.1
0.7
99.3
7.3
18.1
17.9
Vanuatu
43
489
533
8.2
91.8
22
156
178
12.3
87.7
50.4
31.9
33.4
Source: Commonwealth Secretariat (calculated using UNCTADstat and WTO-OECD BaTIS datasets)
Endnotes
1
Since January 2021, following the graduation of Vanuatu in December 2020, the Commonwealth has 13 LDC members.
2
Even in 2019, when the value of world merchandise trade collapsed by 3 per cent, exports of Commonwealth countries grew by 0.4 per cent. This growth was driven by Commonwealth developing countries. Between 2017 and 2019, the combined goods and services exports of developing members grew at 4.5 per cent compared with 3.4 per cent for developed Commonwealth countries.
3
The share of developing countries in the Commonwealth's goods exports expanded from 42 per cent in 2005 to 51 per cent in 2019. The corresponding increase in the share of developing members in services exports has been much higher, from 31 per cent in 2005 to 47 per cent in 2019. Two developing countries, India and Singapore, contributed more than a third of these services exports in 2019.
4
The inflection point for the merchandise exports of Commonwealth developed and developing countries had already been reached in 2009, immediately after the global financial crisis. In that year, the value of goods Commonwealth developing countries exported exceeded that of the exports of their developed counterparts.
5
The UK, Canada, Singapore, India, Australia, Malaysia, South Africa, Nigeria, New Zealand and Bangladesh.
6
The UK, India, Singapore, Canada, Australia, Malaysia, Malta, New Zealand, South Africa and Cyprus.
7
Computed as: (EXP(0.192)-1)*100
8
By comparison, the share of developed economies declined from 40 per cent to 33 per cent, a 7-percentage-point drop.
9
This is a composite measure based on nine response indicators including school closures, workplace closures and travel bans, rescaled to a value from 0 to 100 (100 = strictest).
10
In Bangladesh, for example, more than half of garment manufacturers in an online survey had orders cancelled (Anner, 2020). Buyers in the USA and the EU cancelled orders to the tune of US$1.5 billion from Bangladesh alone, affecting more than 1,000 garment factories in the country (Devnath, 2020).
11
In Bangladesh, more than 1 million garment workers lost their jobs or were furloughed before the end of March 2020 (Anner, 2020). A survey by the Worker Rights Consortium (2020), spanning 396 garment sector workers (70 per cent of whom were women) in 158 factories across 9 countries (including Bangladesh, India and Lesotho), found that 38 per cent of workers had either lost their jobs or had them temporarily suspended as a result of the pandemic.
Examples include hotels and restaurants, as well as distribution (although some parts of the retail sector have been exempted from restrictions to facilitate the supply of essential goods).
14
This is estimated using the long-run average trade growth rate of 5 per cent during 2010-2019.
15
The Commonwealth has a strong network of institutions, private sector bodies and trade experts. There are more than 80 accredited organisations working to deliver dedicated work programmes and facilitate people-to-people contacts. For example, the Intra-Commonwealth SME Association, the Commonwealth Alliance of Young Entrepreneurs, the Commonwealth Businesswomen's Network and the Commonwealth Enterprise and Investment Council, among others, enable regular interaction, information-sharing and identification of commercial opportunities. Two Intra-Commonwealth SME Trade Summits have been held in India (May 2017) and Kenya (May 2019).
 Note: The chart presents total global exports of 54 Commonwealth member countries, good and services combined.
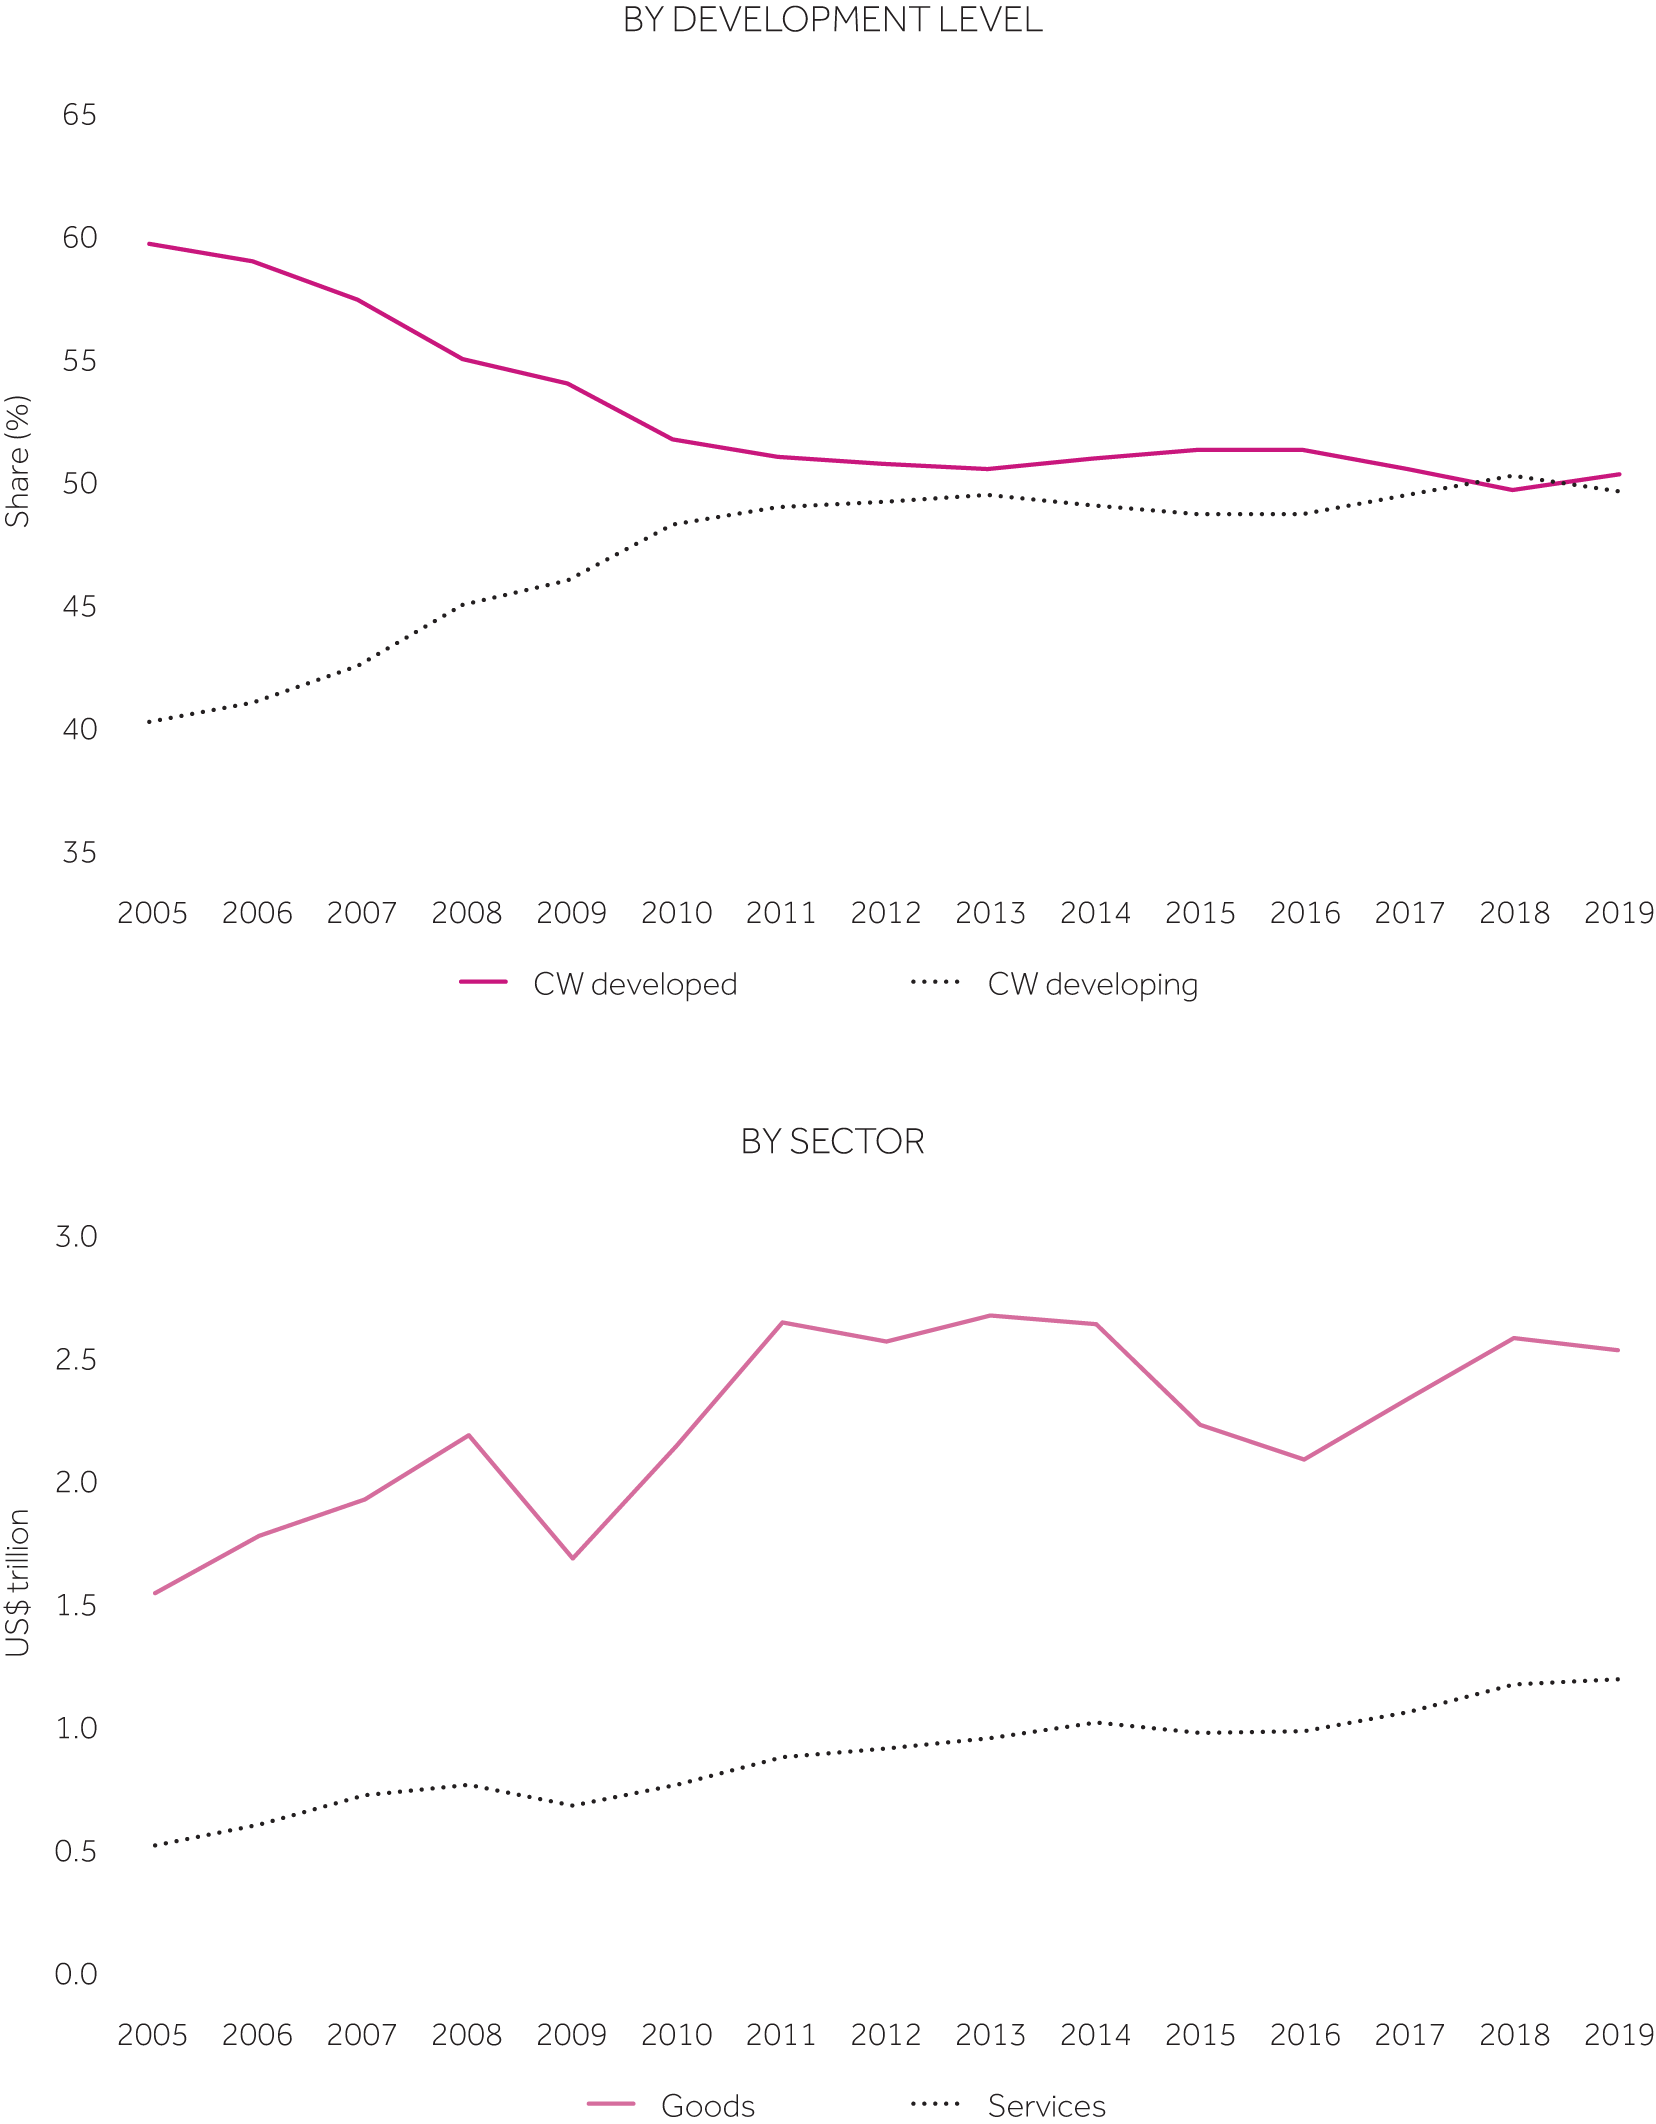 Source: Commonwealth Secretariat (calculated using UNCTADstat and WTO-OECD BaTIS datasets)
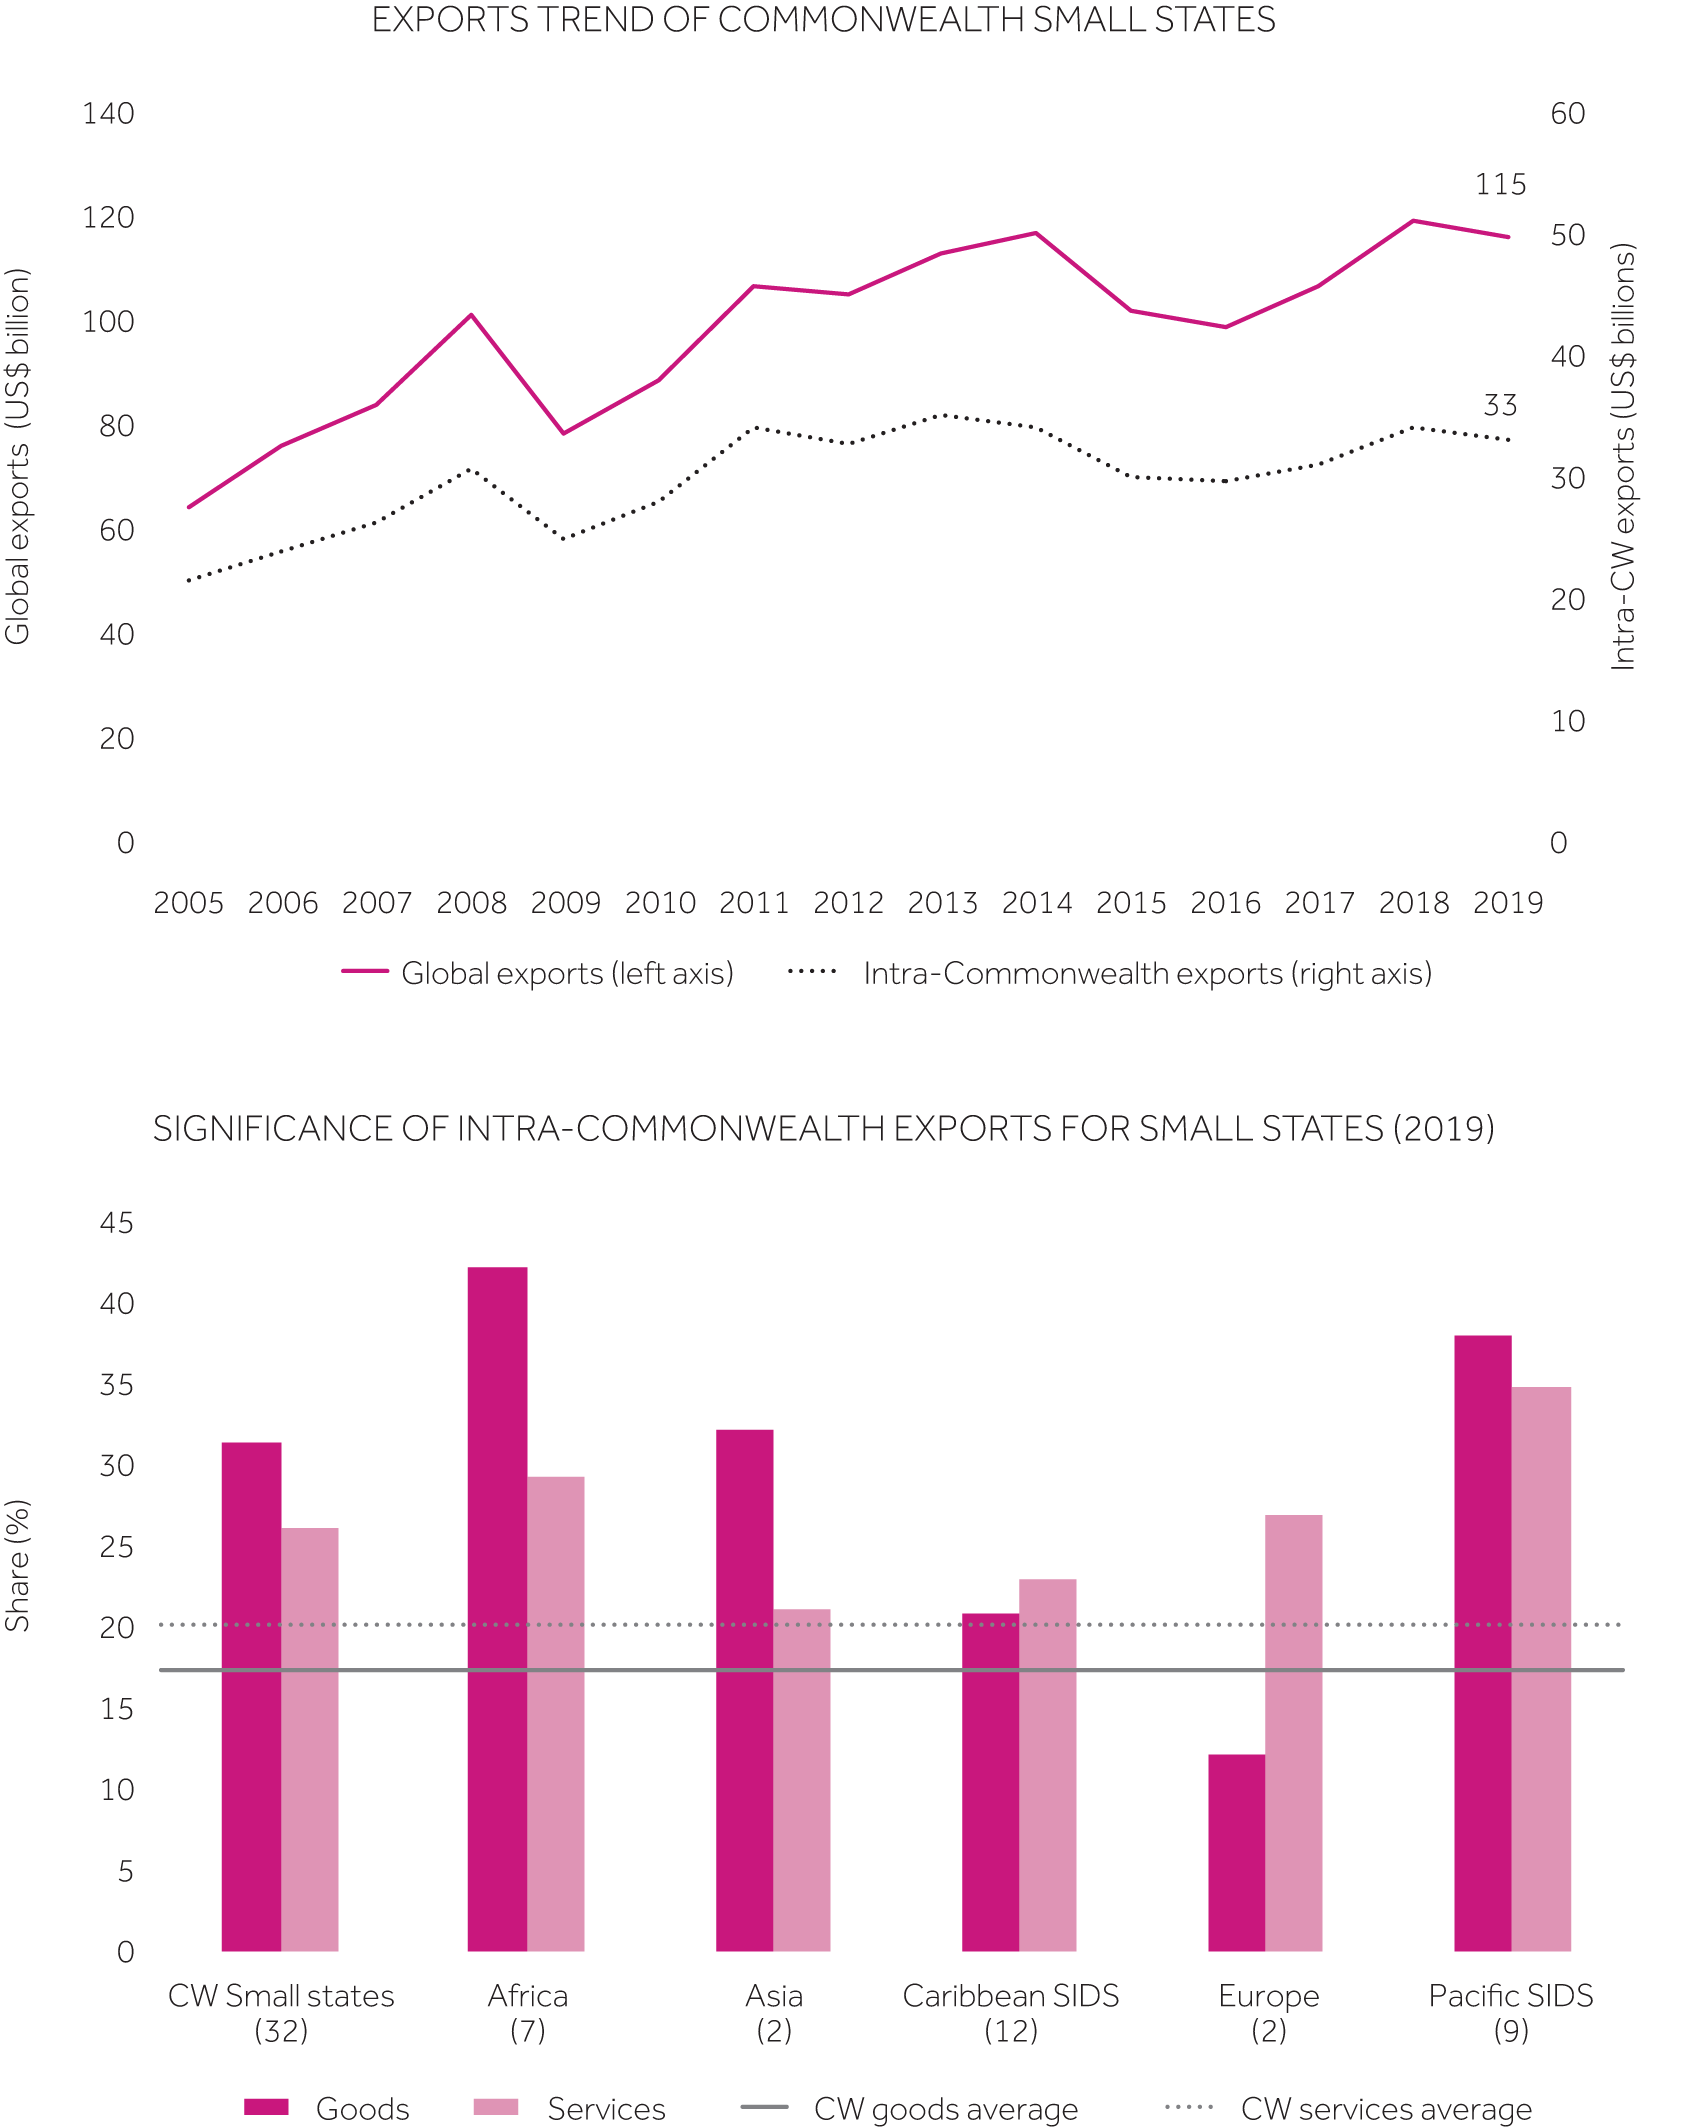 Source: Commonwealth Secretariat (calculated using UNCTADstat and WTO-OECD BaTIS datasets)
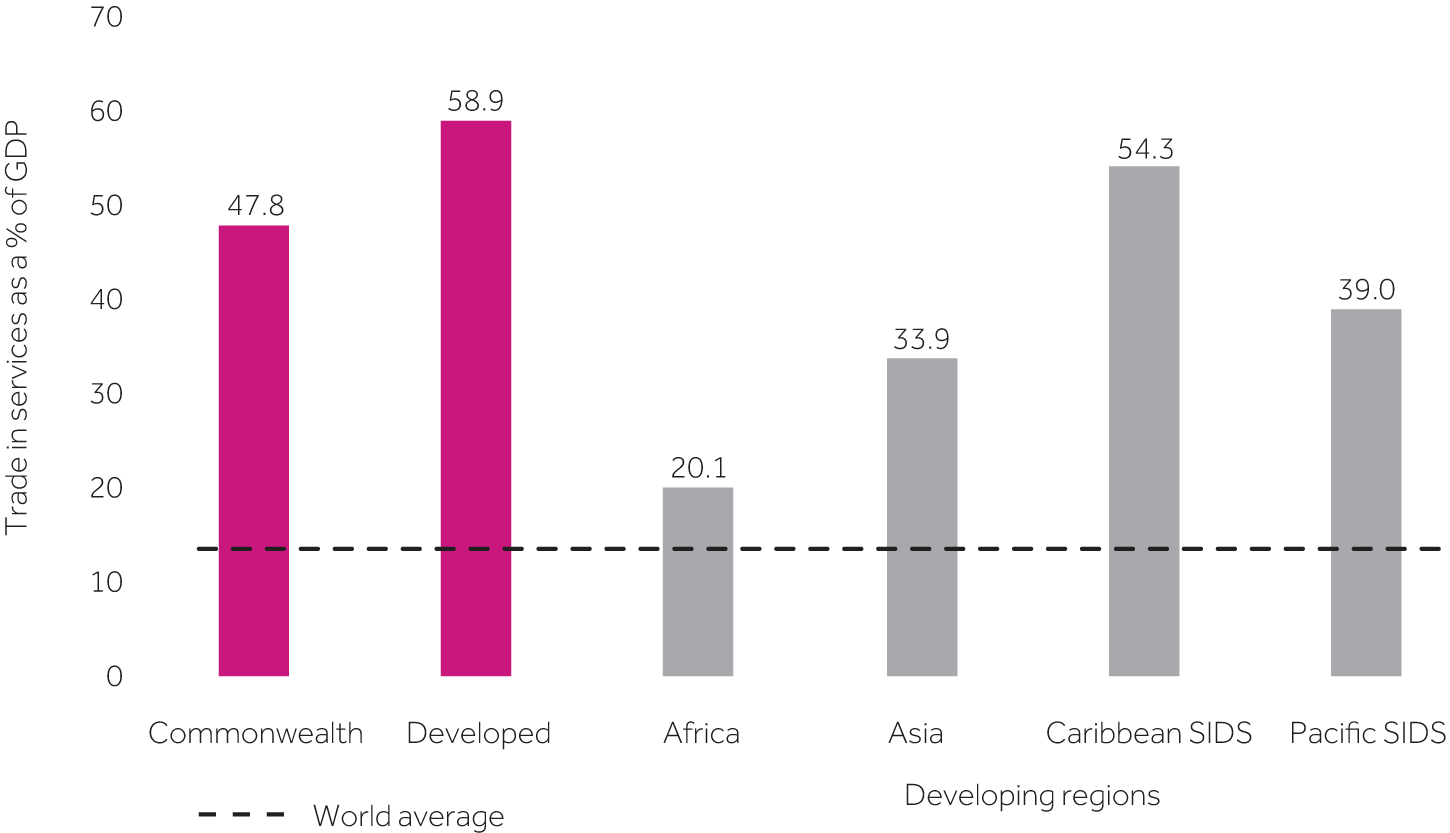 Note: Nauru excluded owing to non-availability of data; the dotted line indicates the world average.
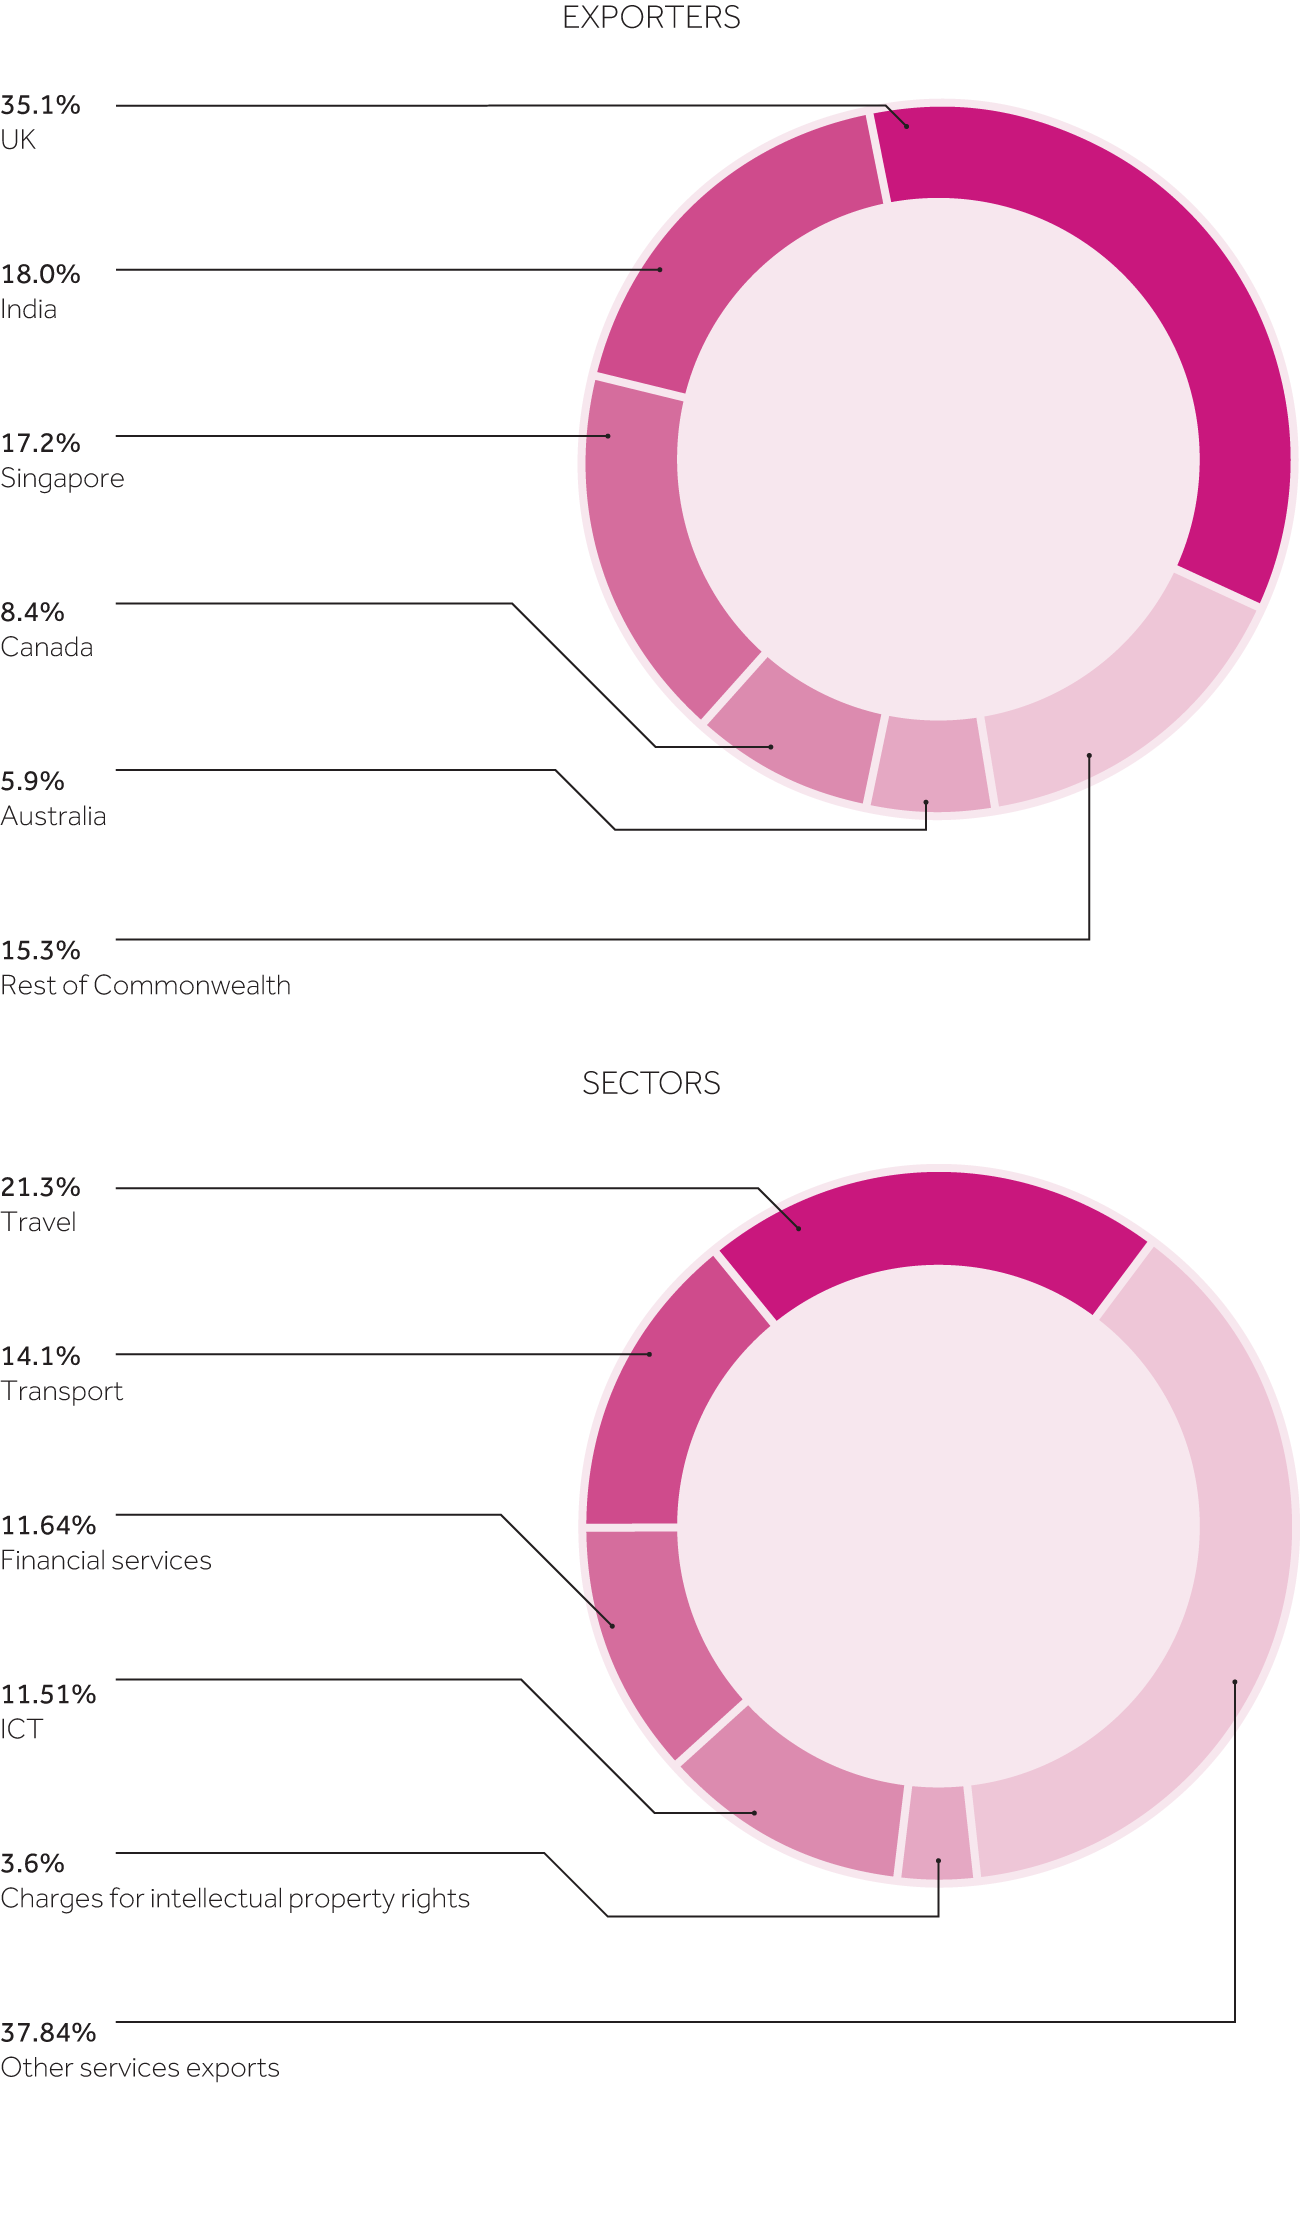 Source: Commonwealth Secretariat (calculated using WTO-OECD BaTIS dataset)
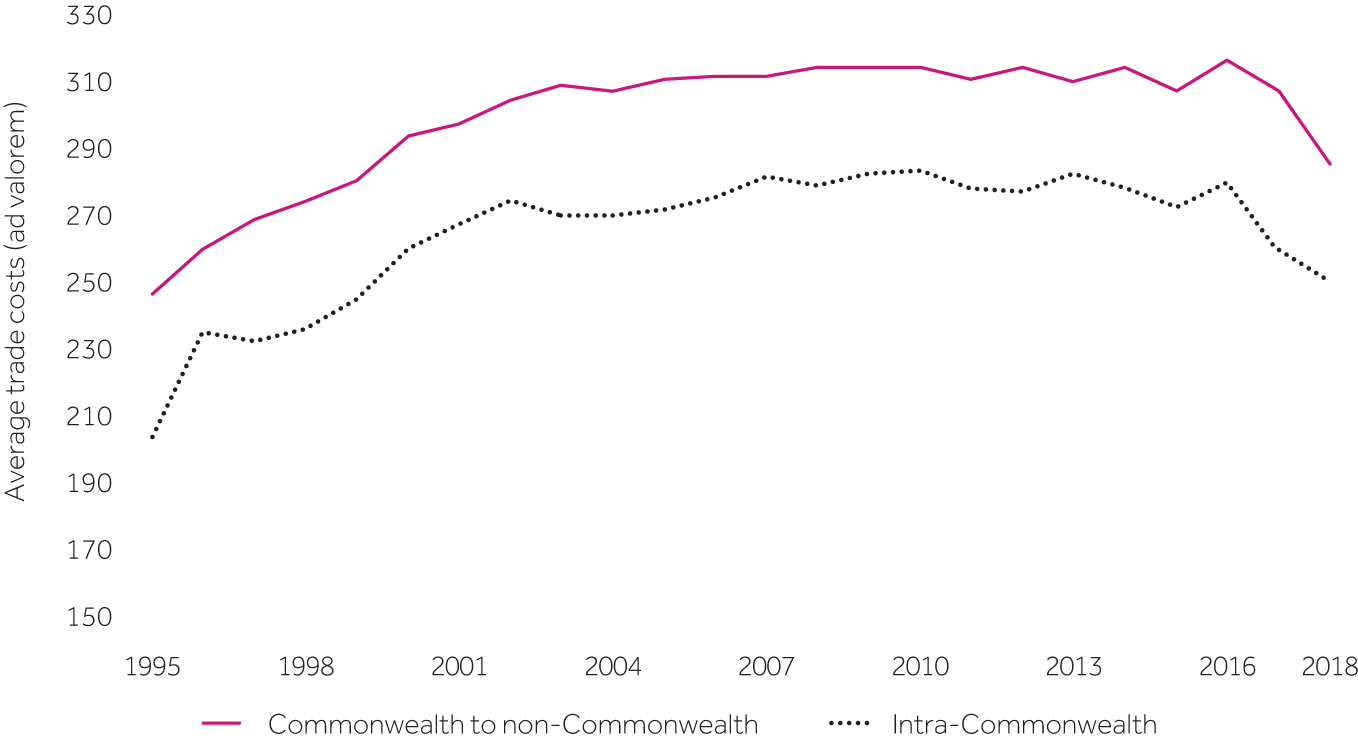 Source: Commonwealth Secretariat (calculated using World Bank Trade Costs dataset)
 Source: Commonwealth Secretariat (calculated from UNCTADstat and OECD-WTO BaTIS datasets)
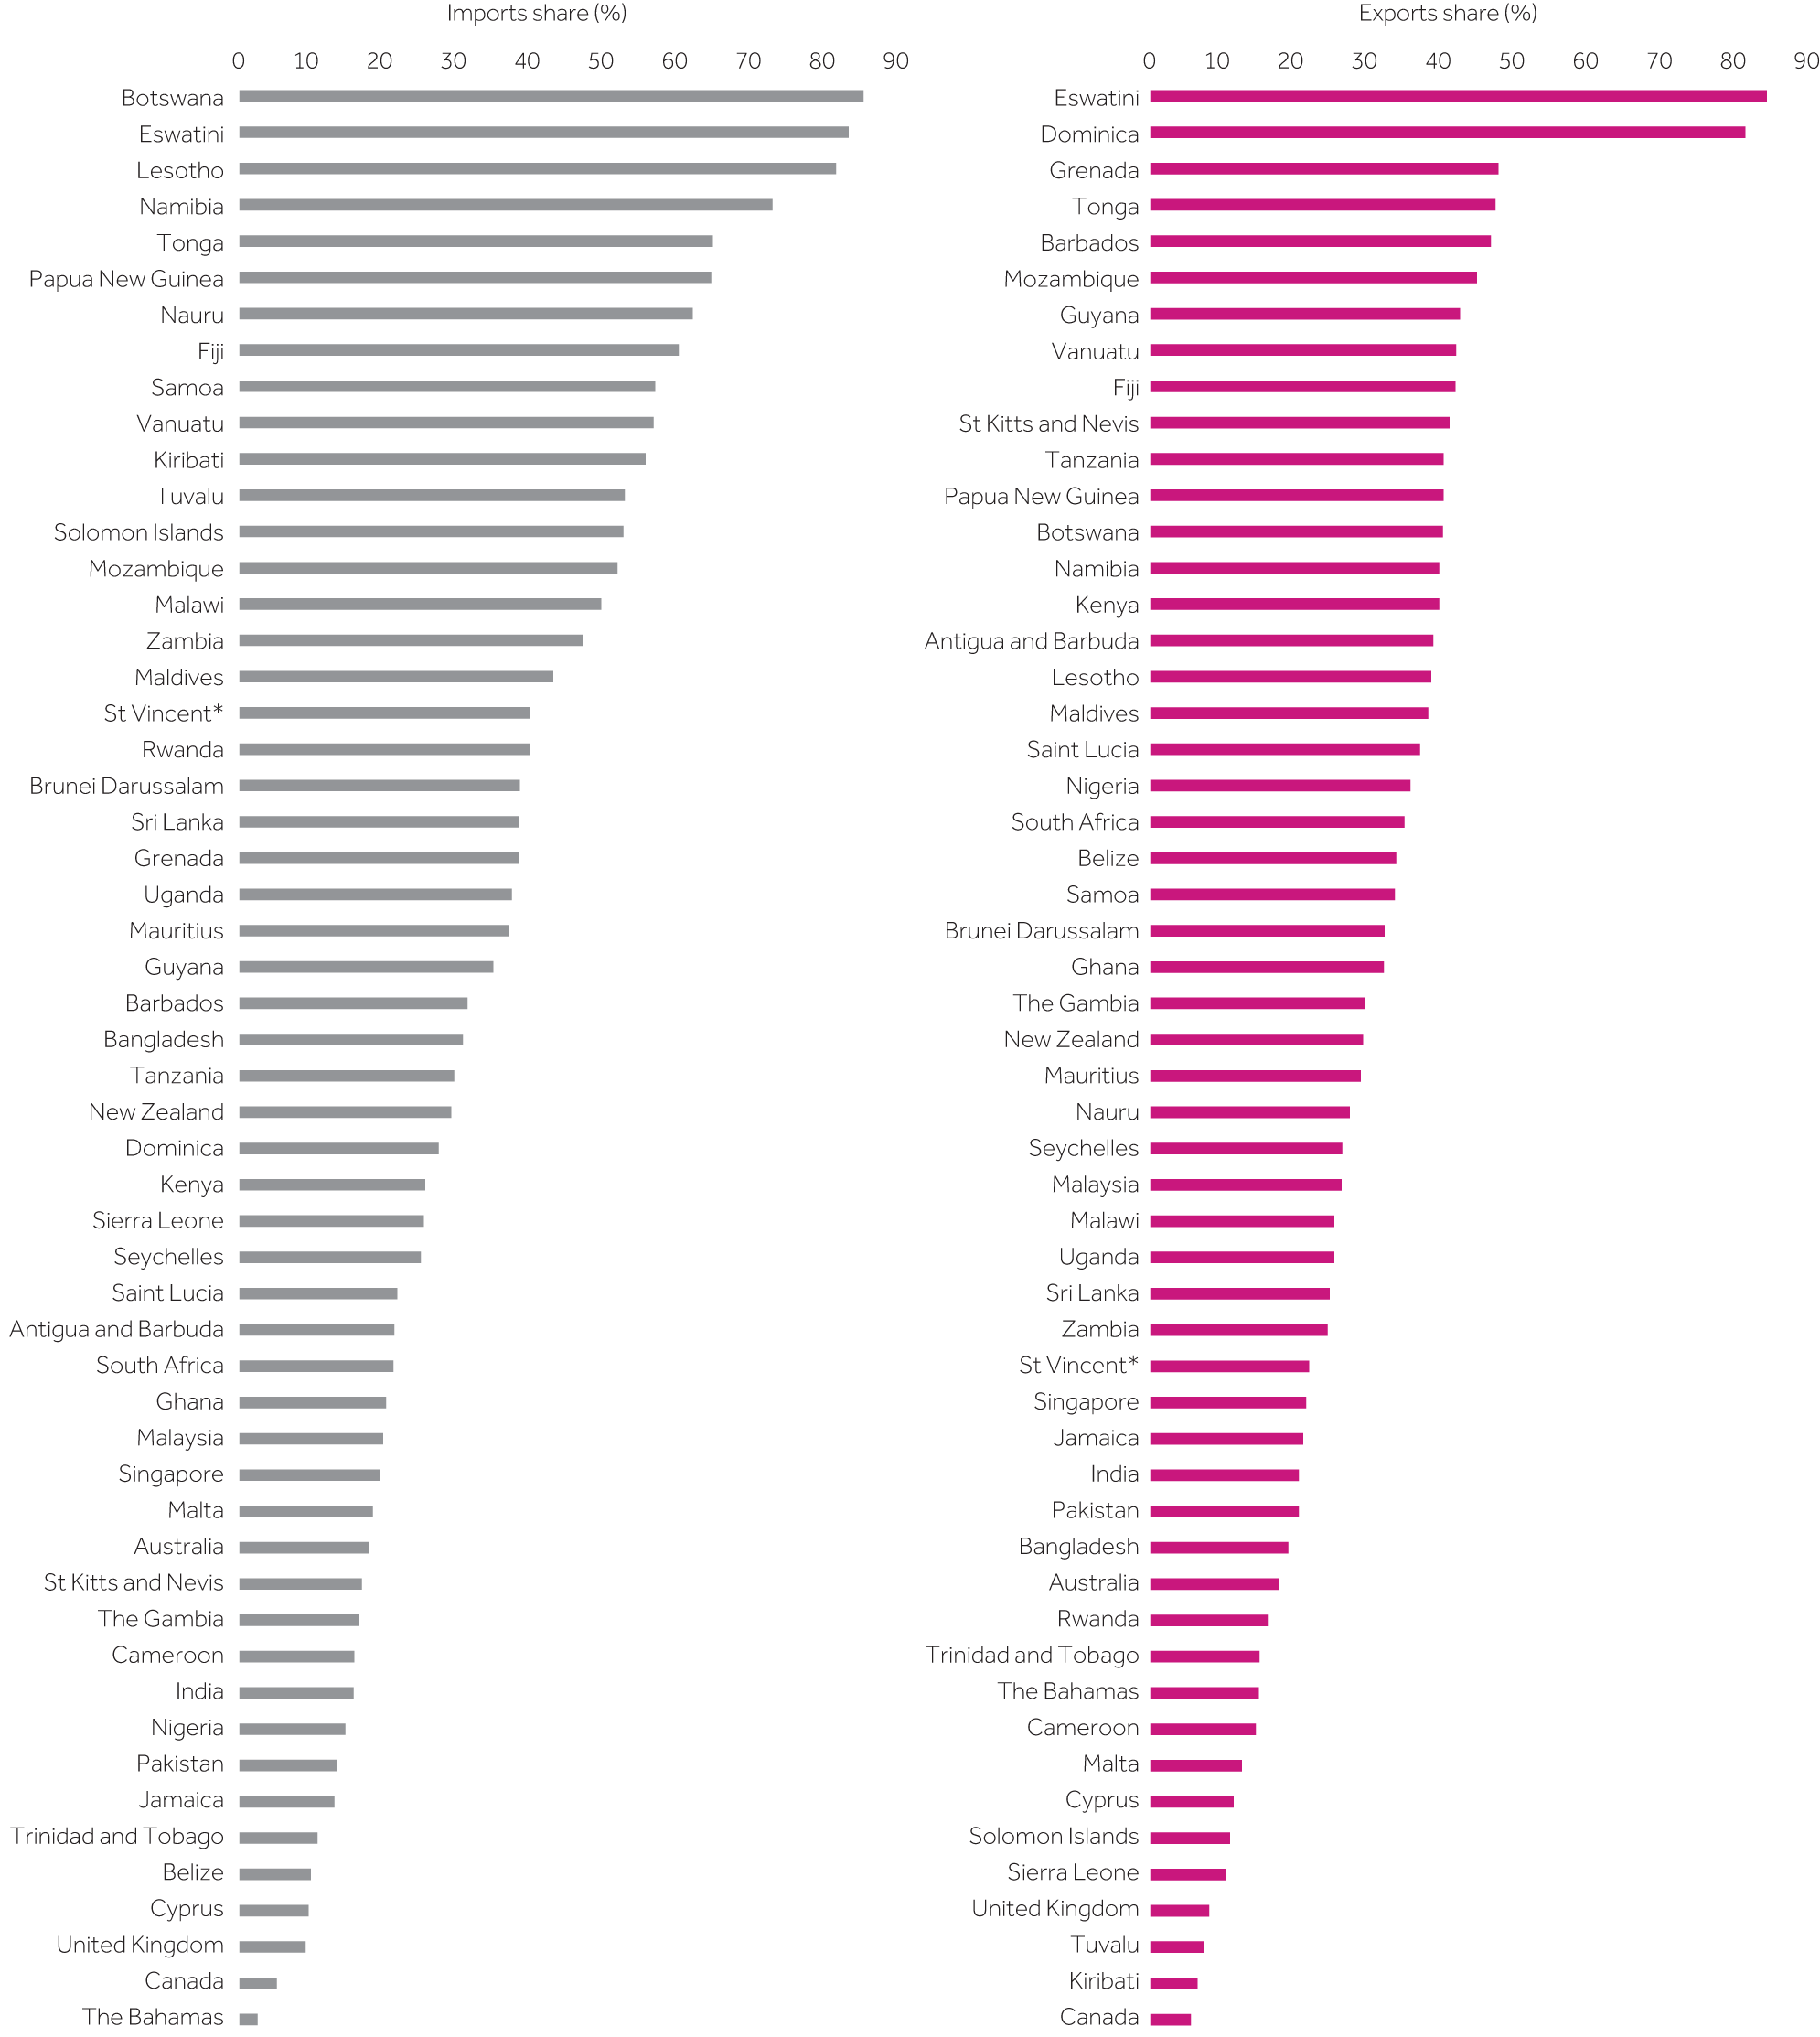 Source: Commonwealth Secretariat (calculated using UNCTADstat dataset) *St Vincent and the Grenadines due to space constraints
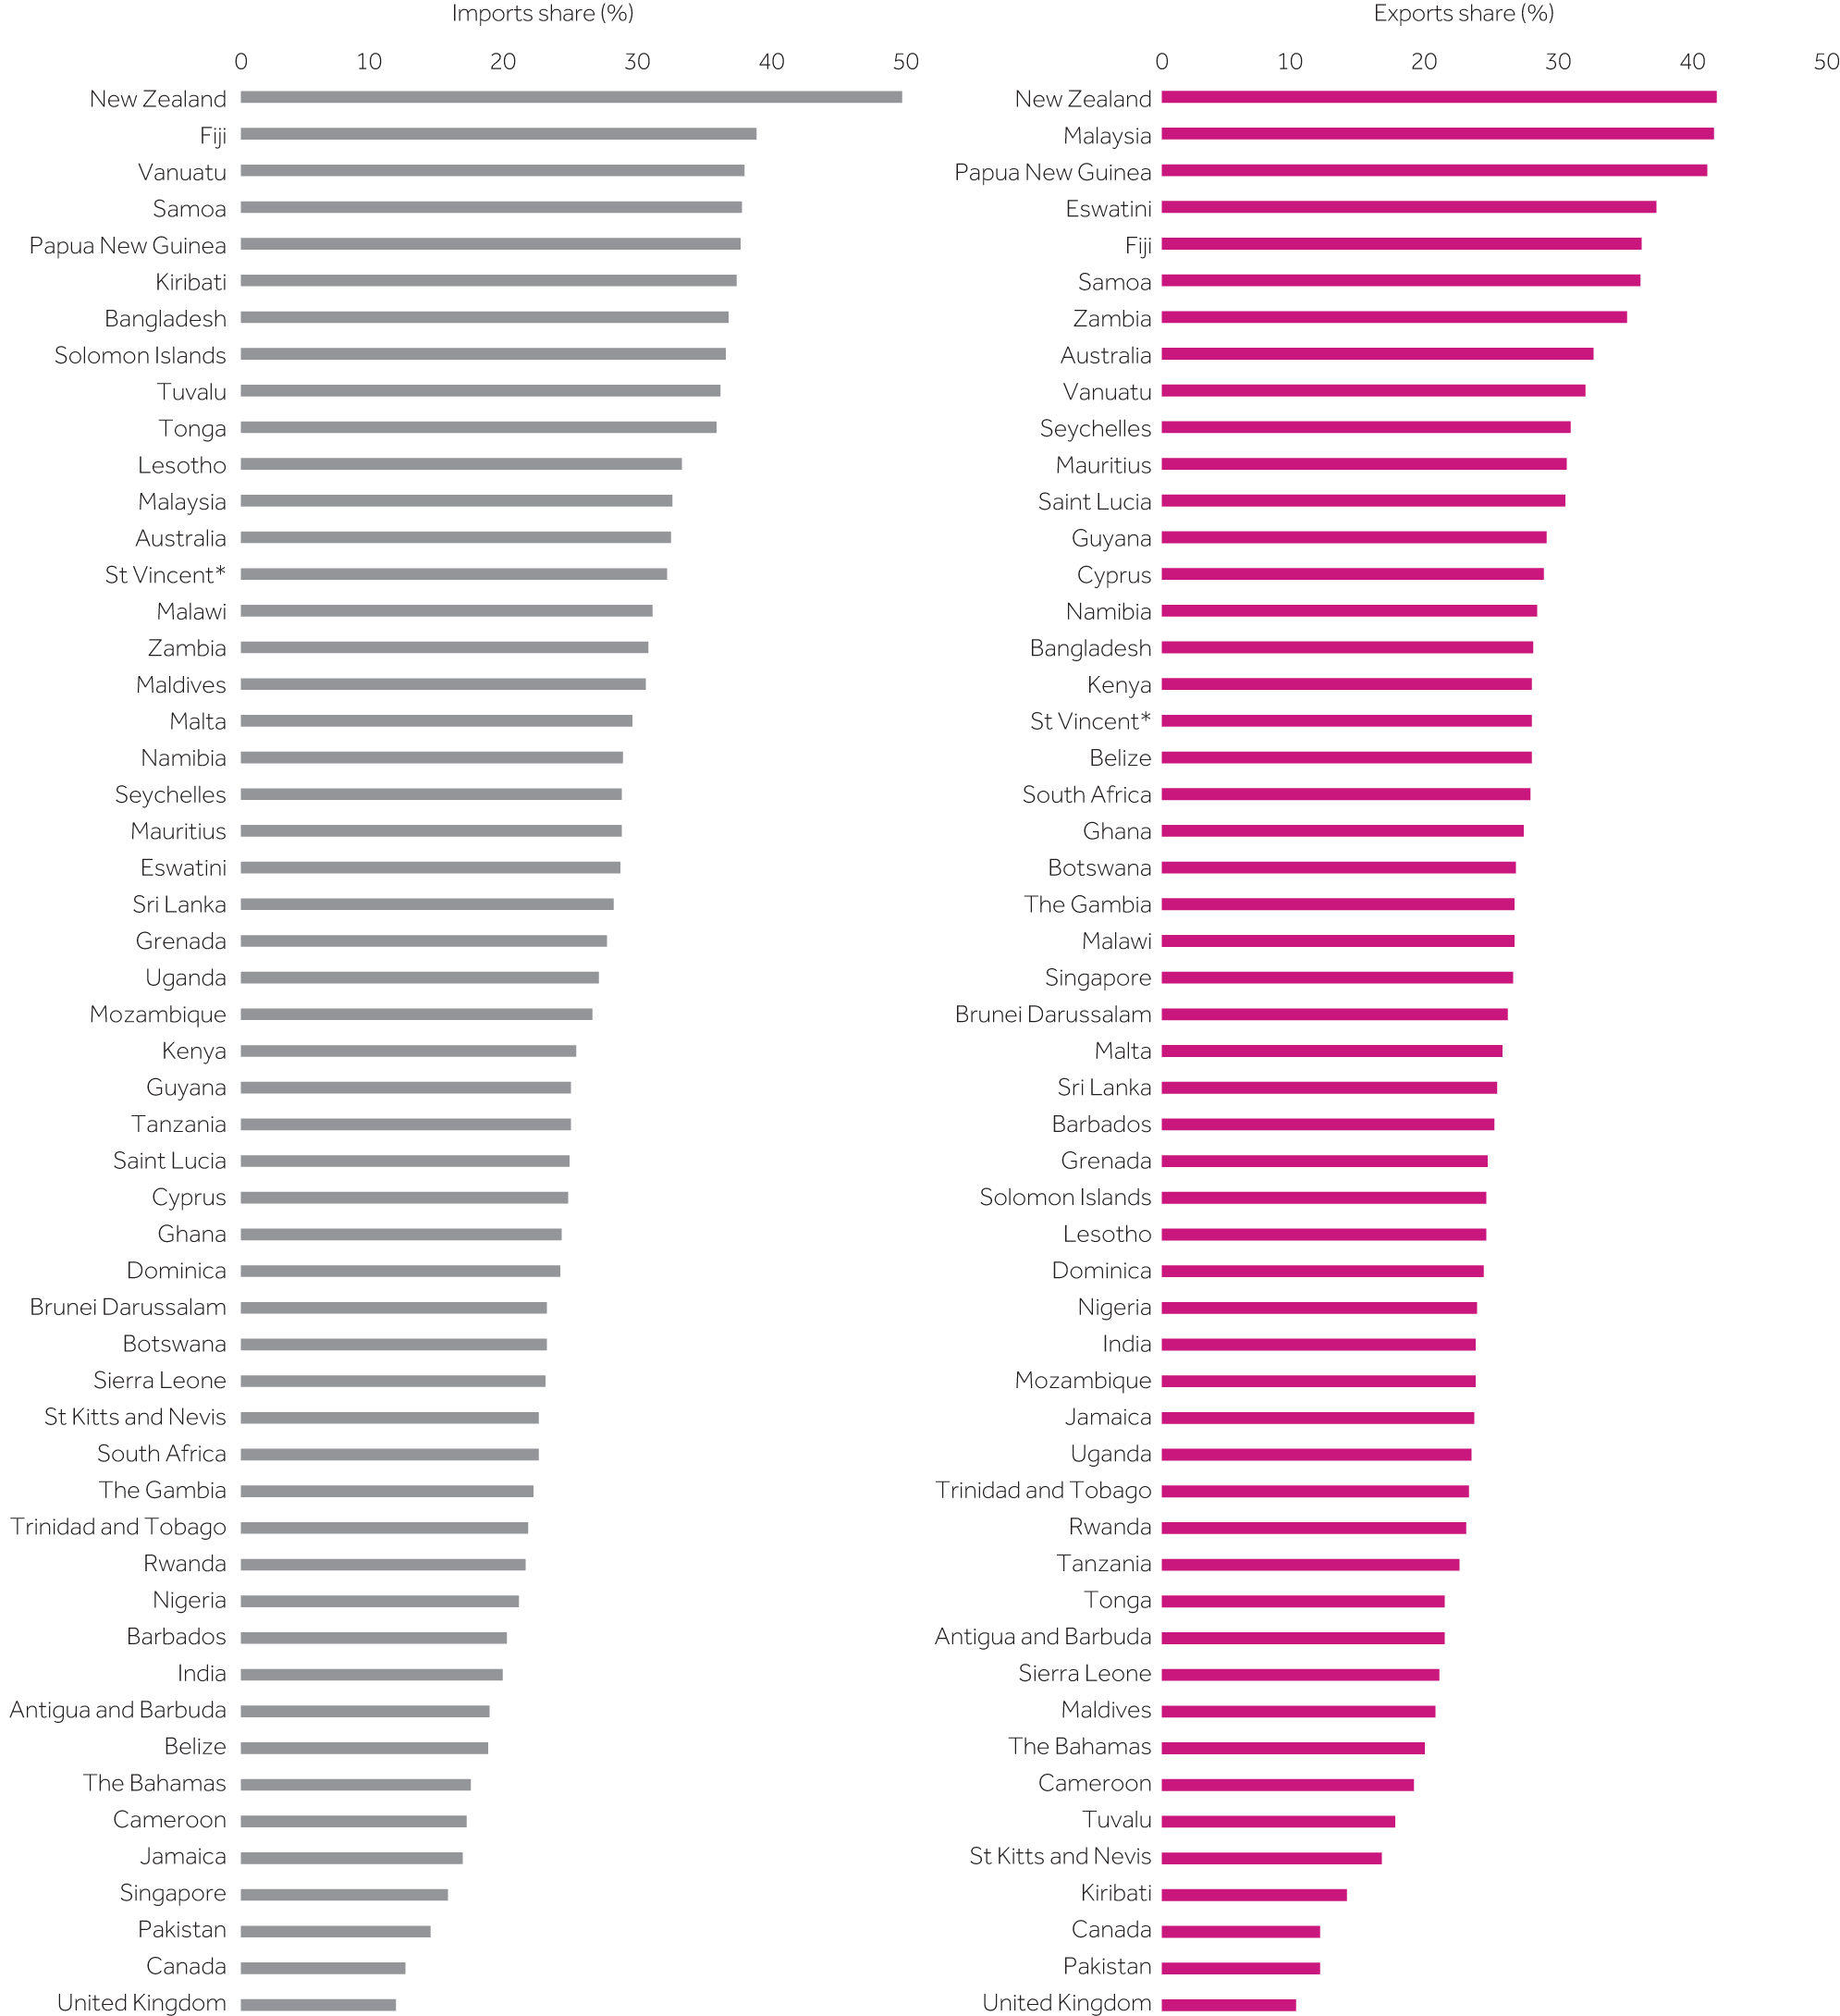 Source: Commonwealth Secretariat (calculated using WTO-OECD BaTIS dataset) *St Vincent and the Grenadines due to space constraints
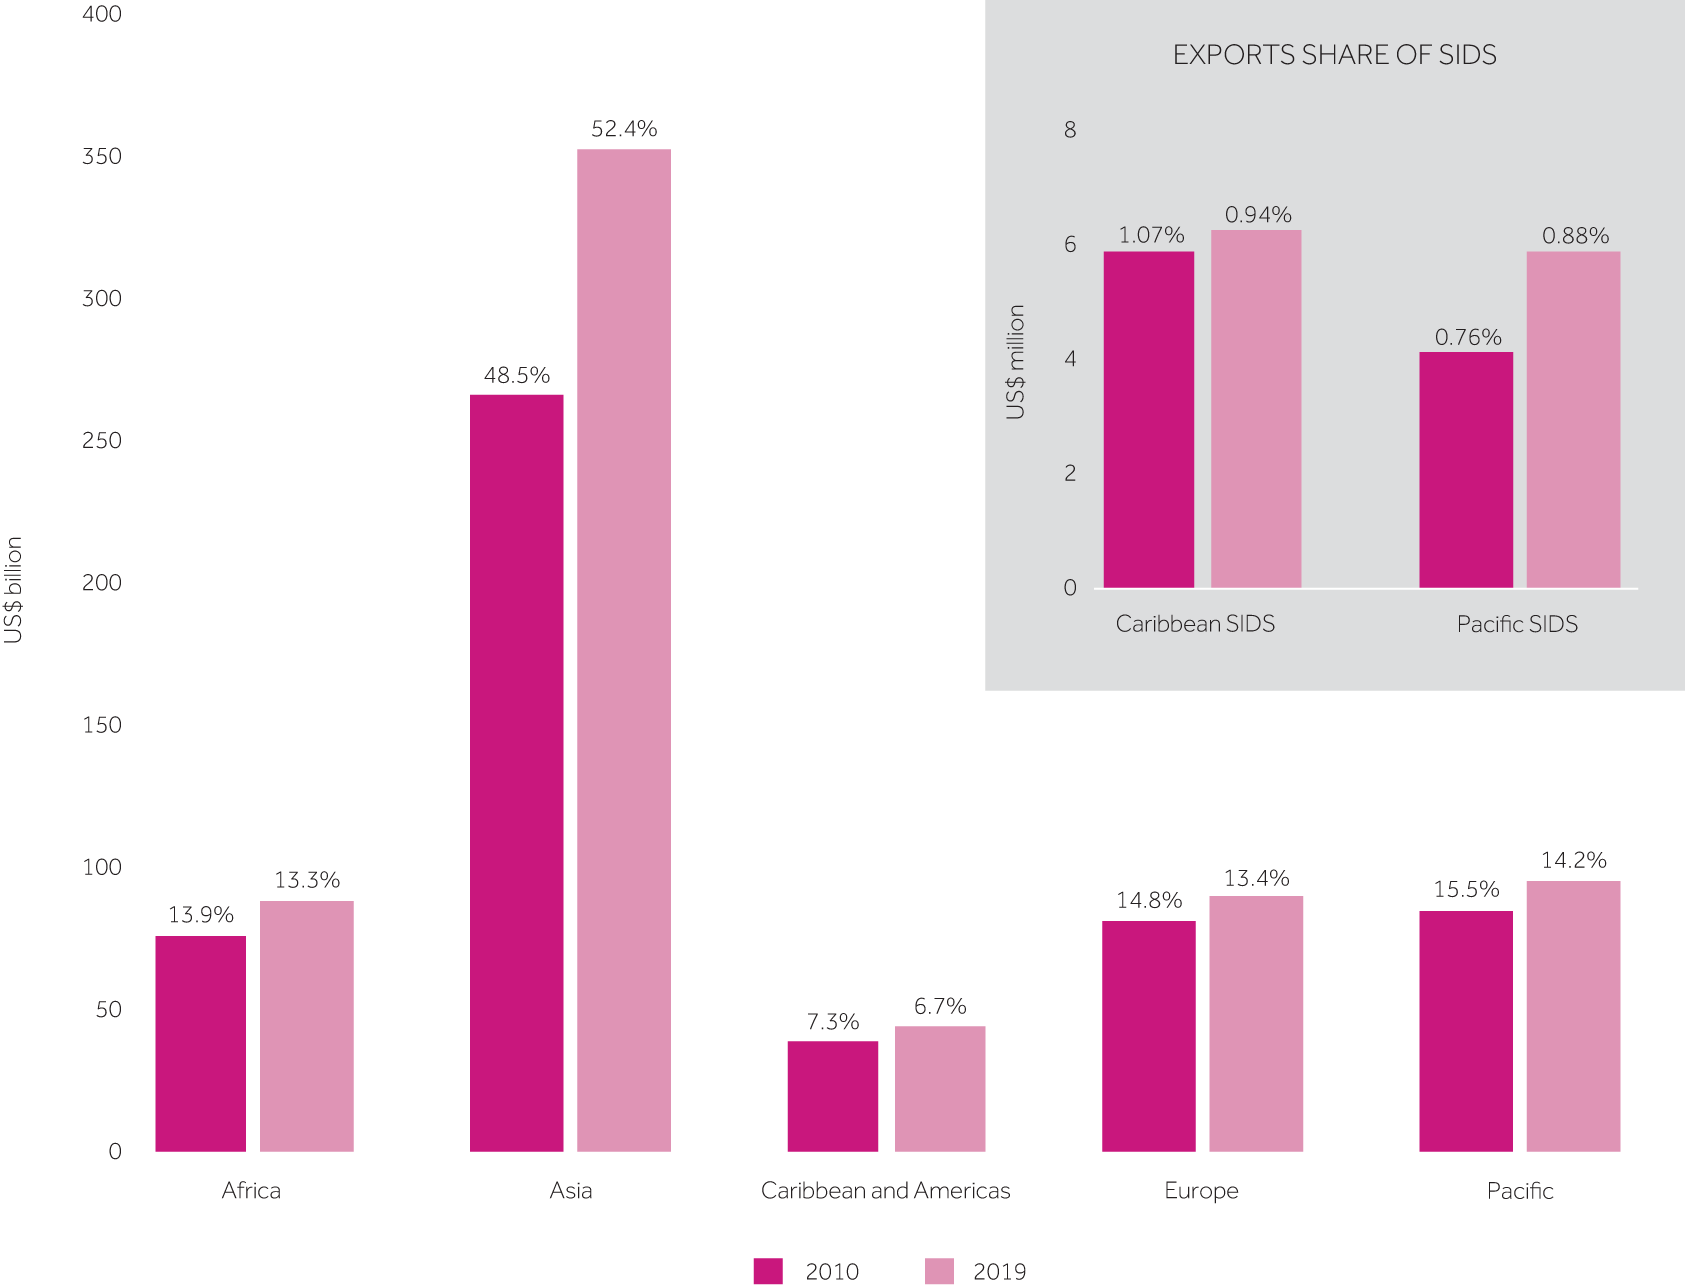 Source: Commonwealth Secretariat (calculated using UNCTADstat and WTO-OECD BaTIS datasets)
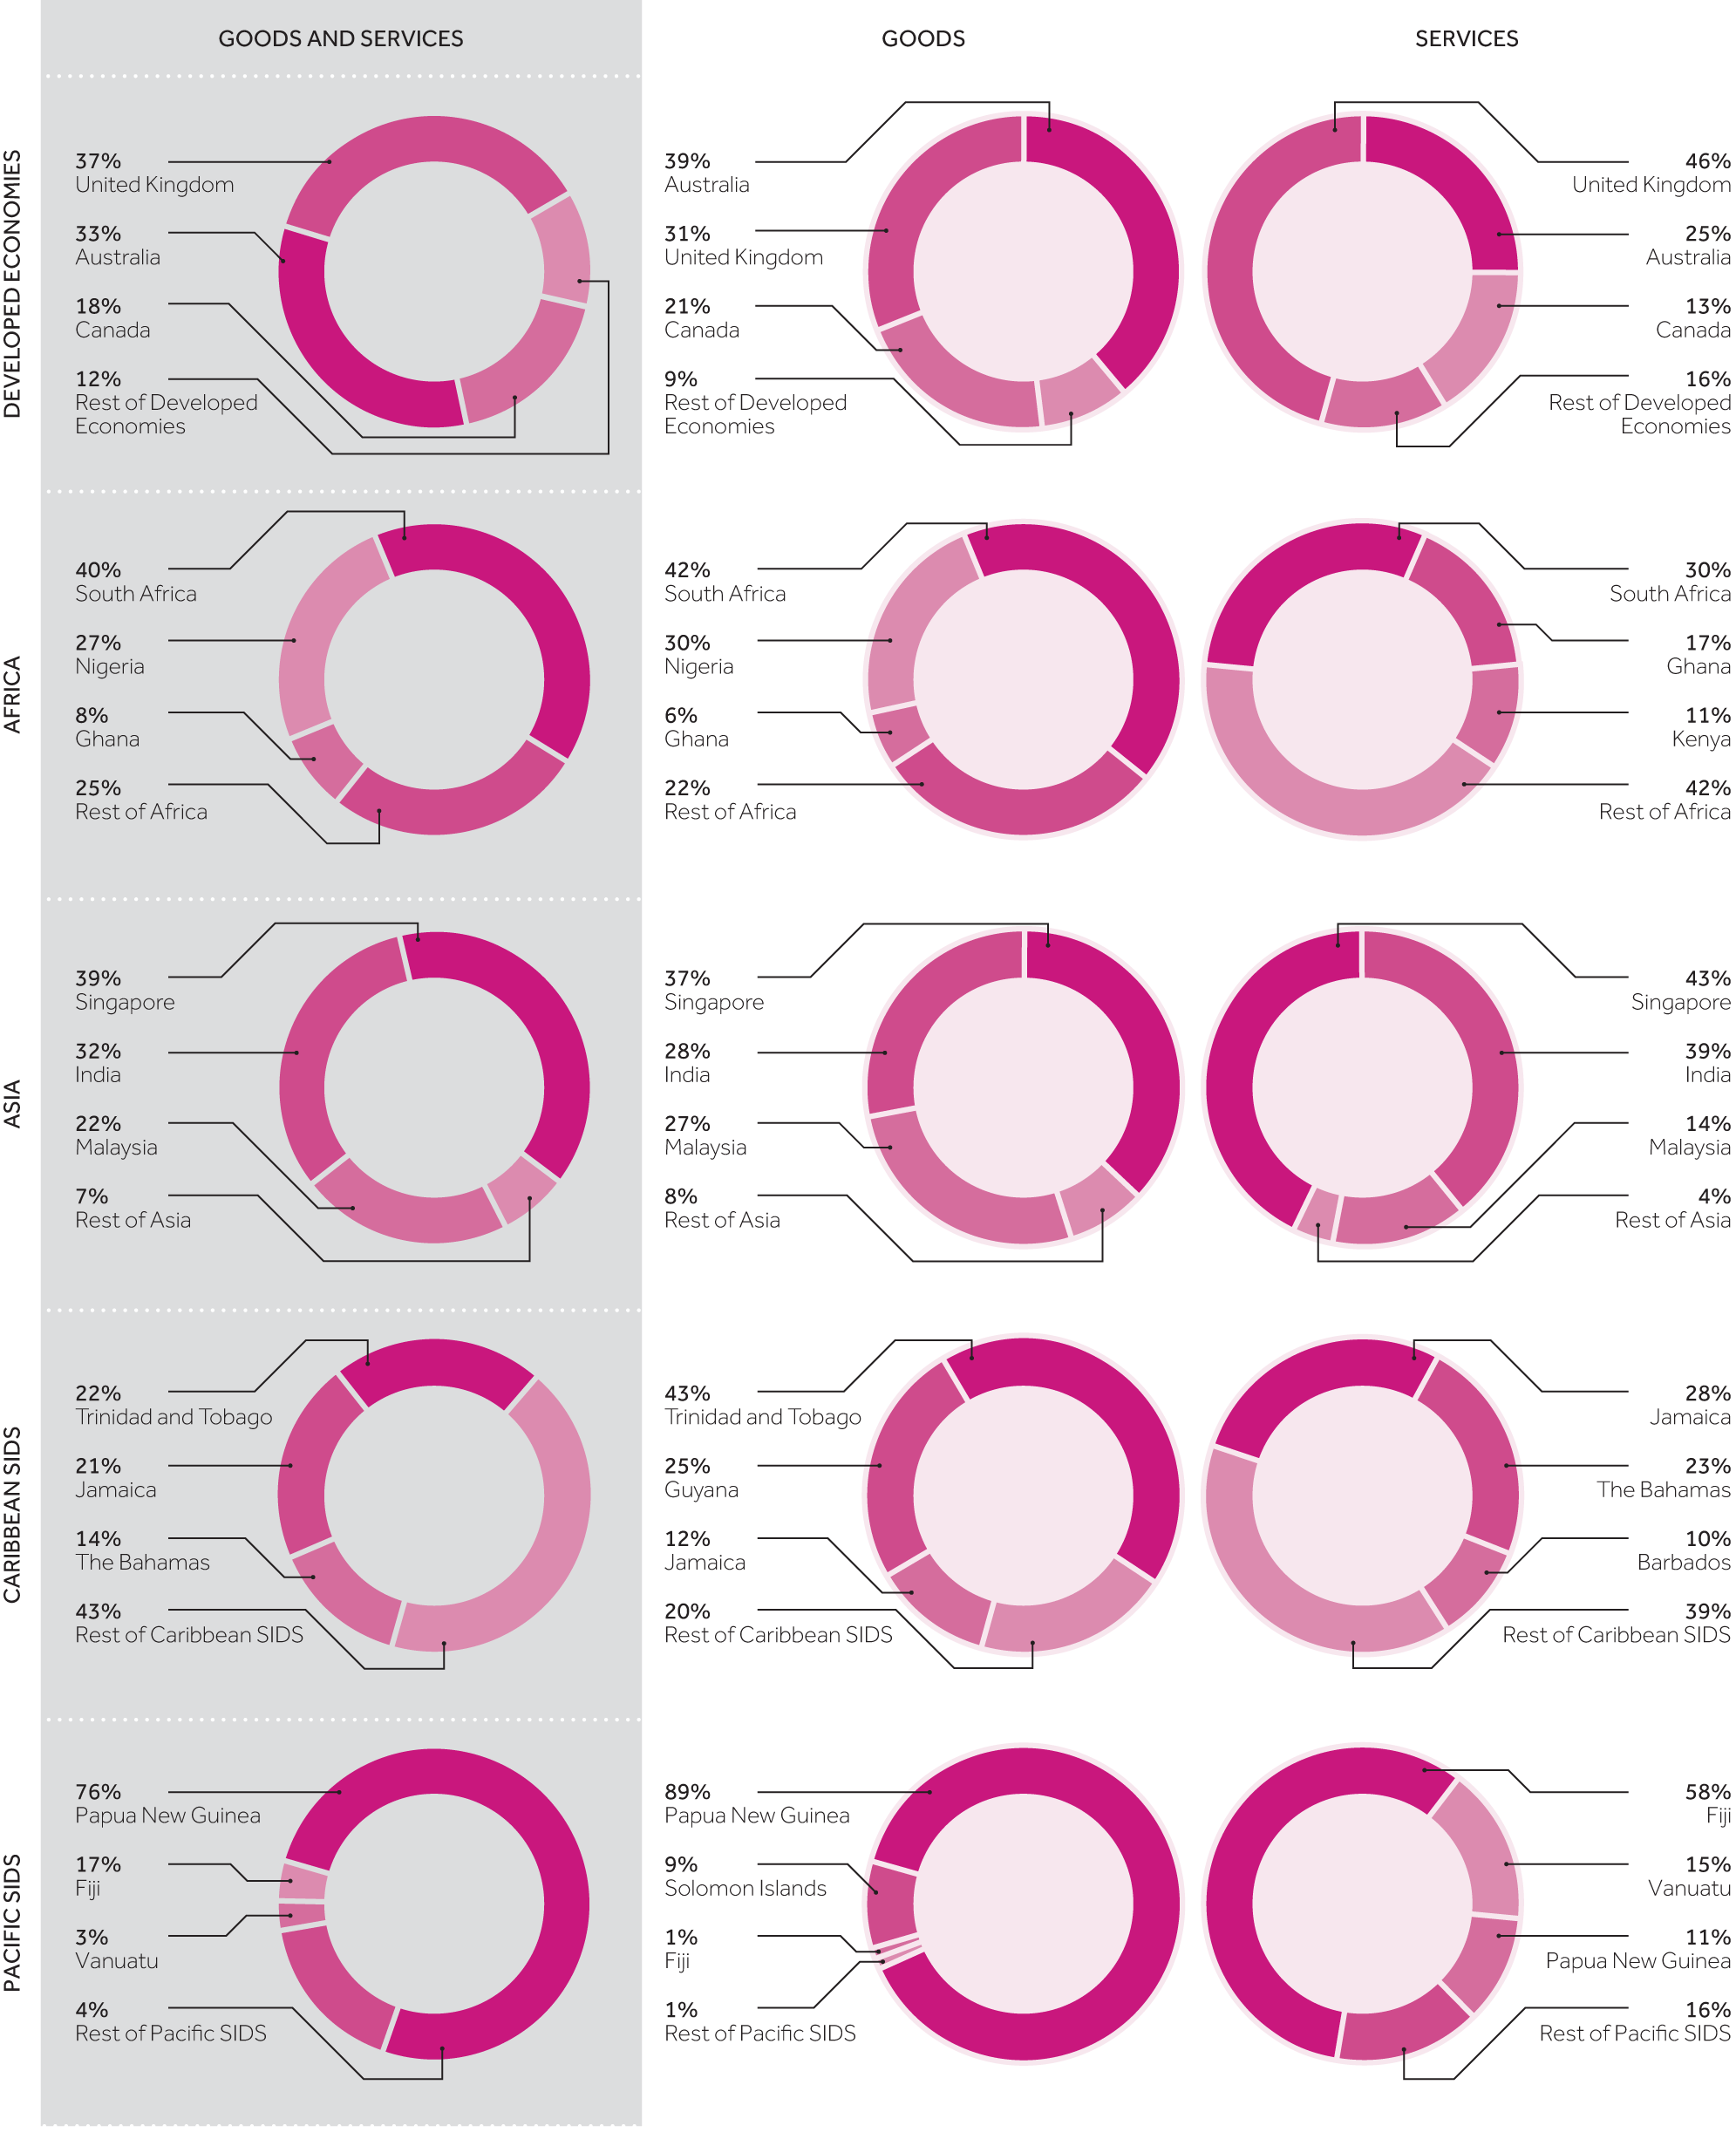 Source: Commonwealth Secretariat (calculated using UNCTADstat and WTO-OECD BaTIS datasets)
 Source: Commonwealth Secretariat (calculated using UNCTADstat dataset)
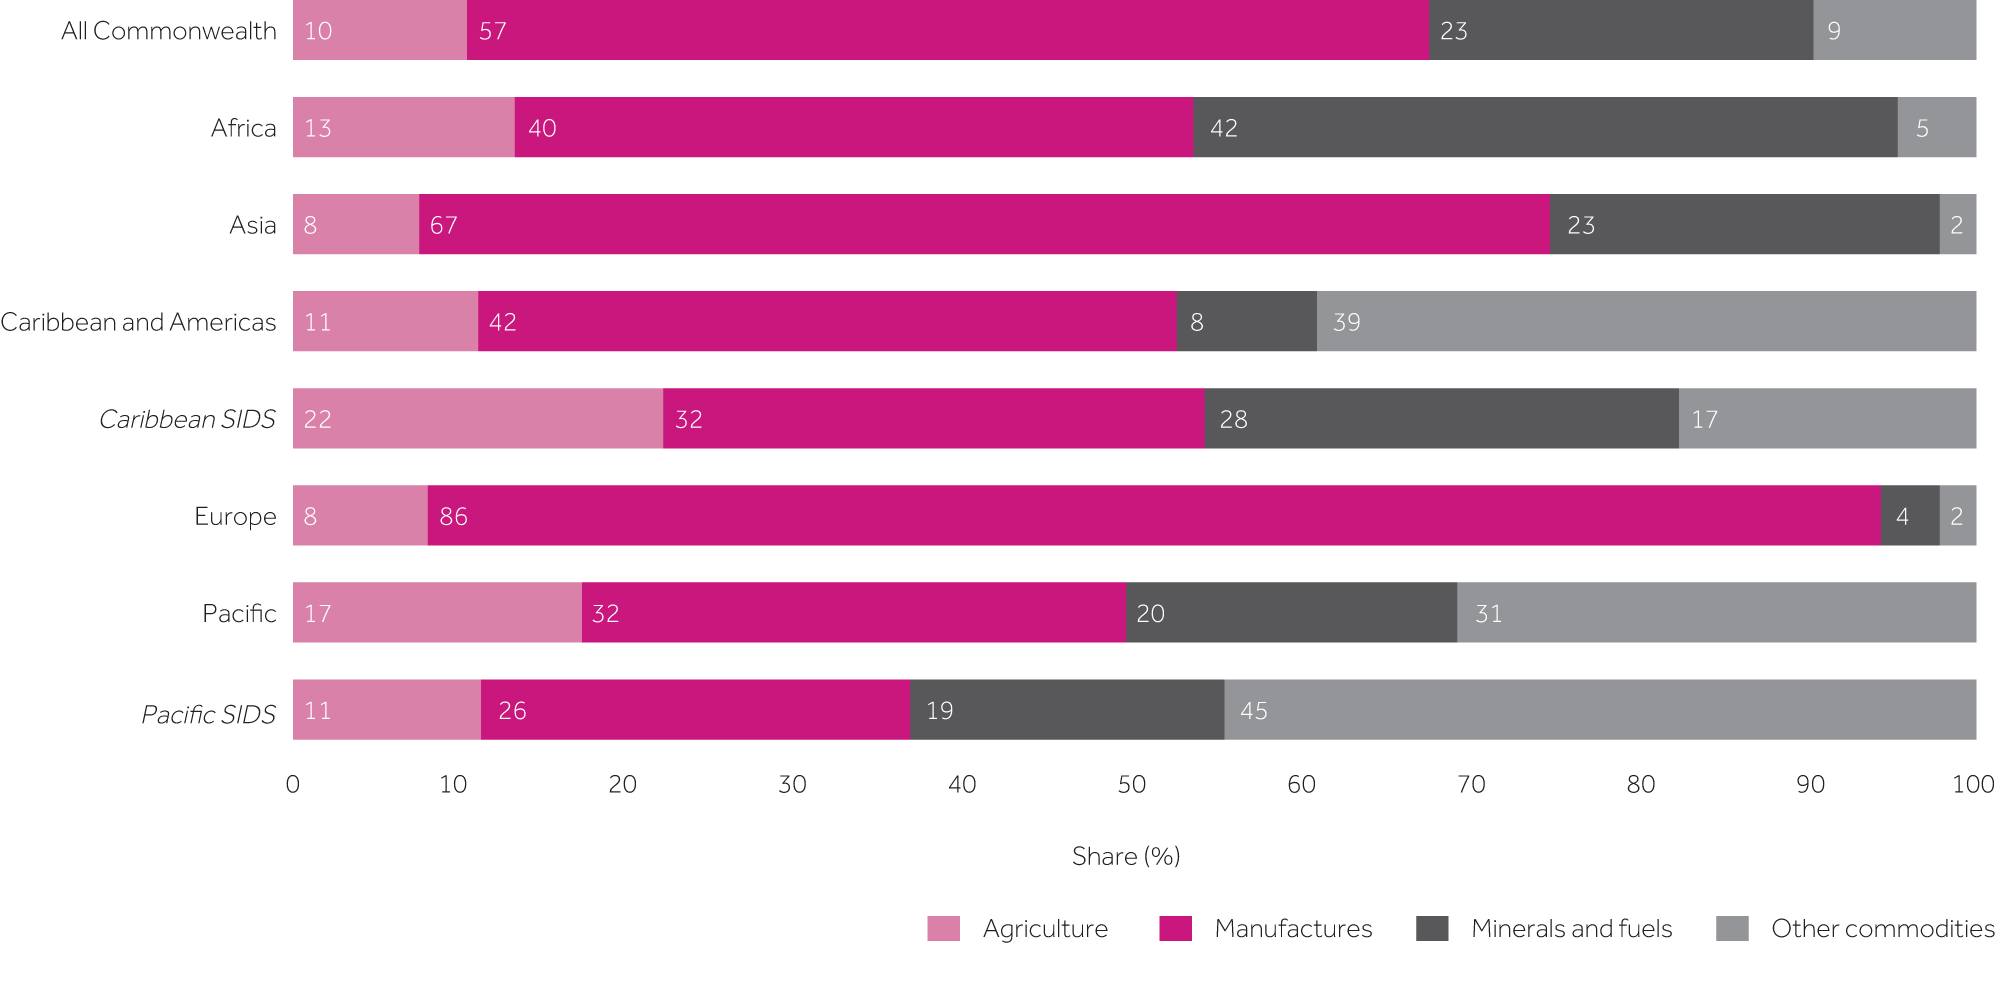 Note: "Other commodities" includes gold and coins (non-monetary).
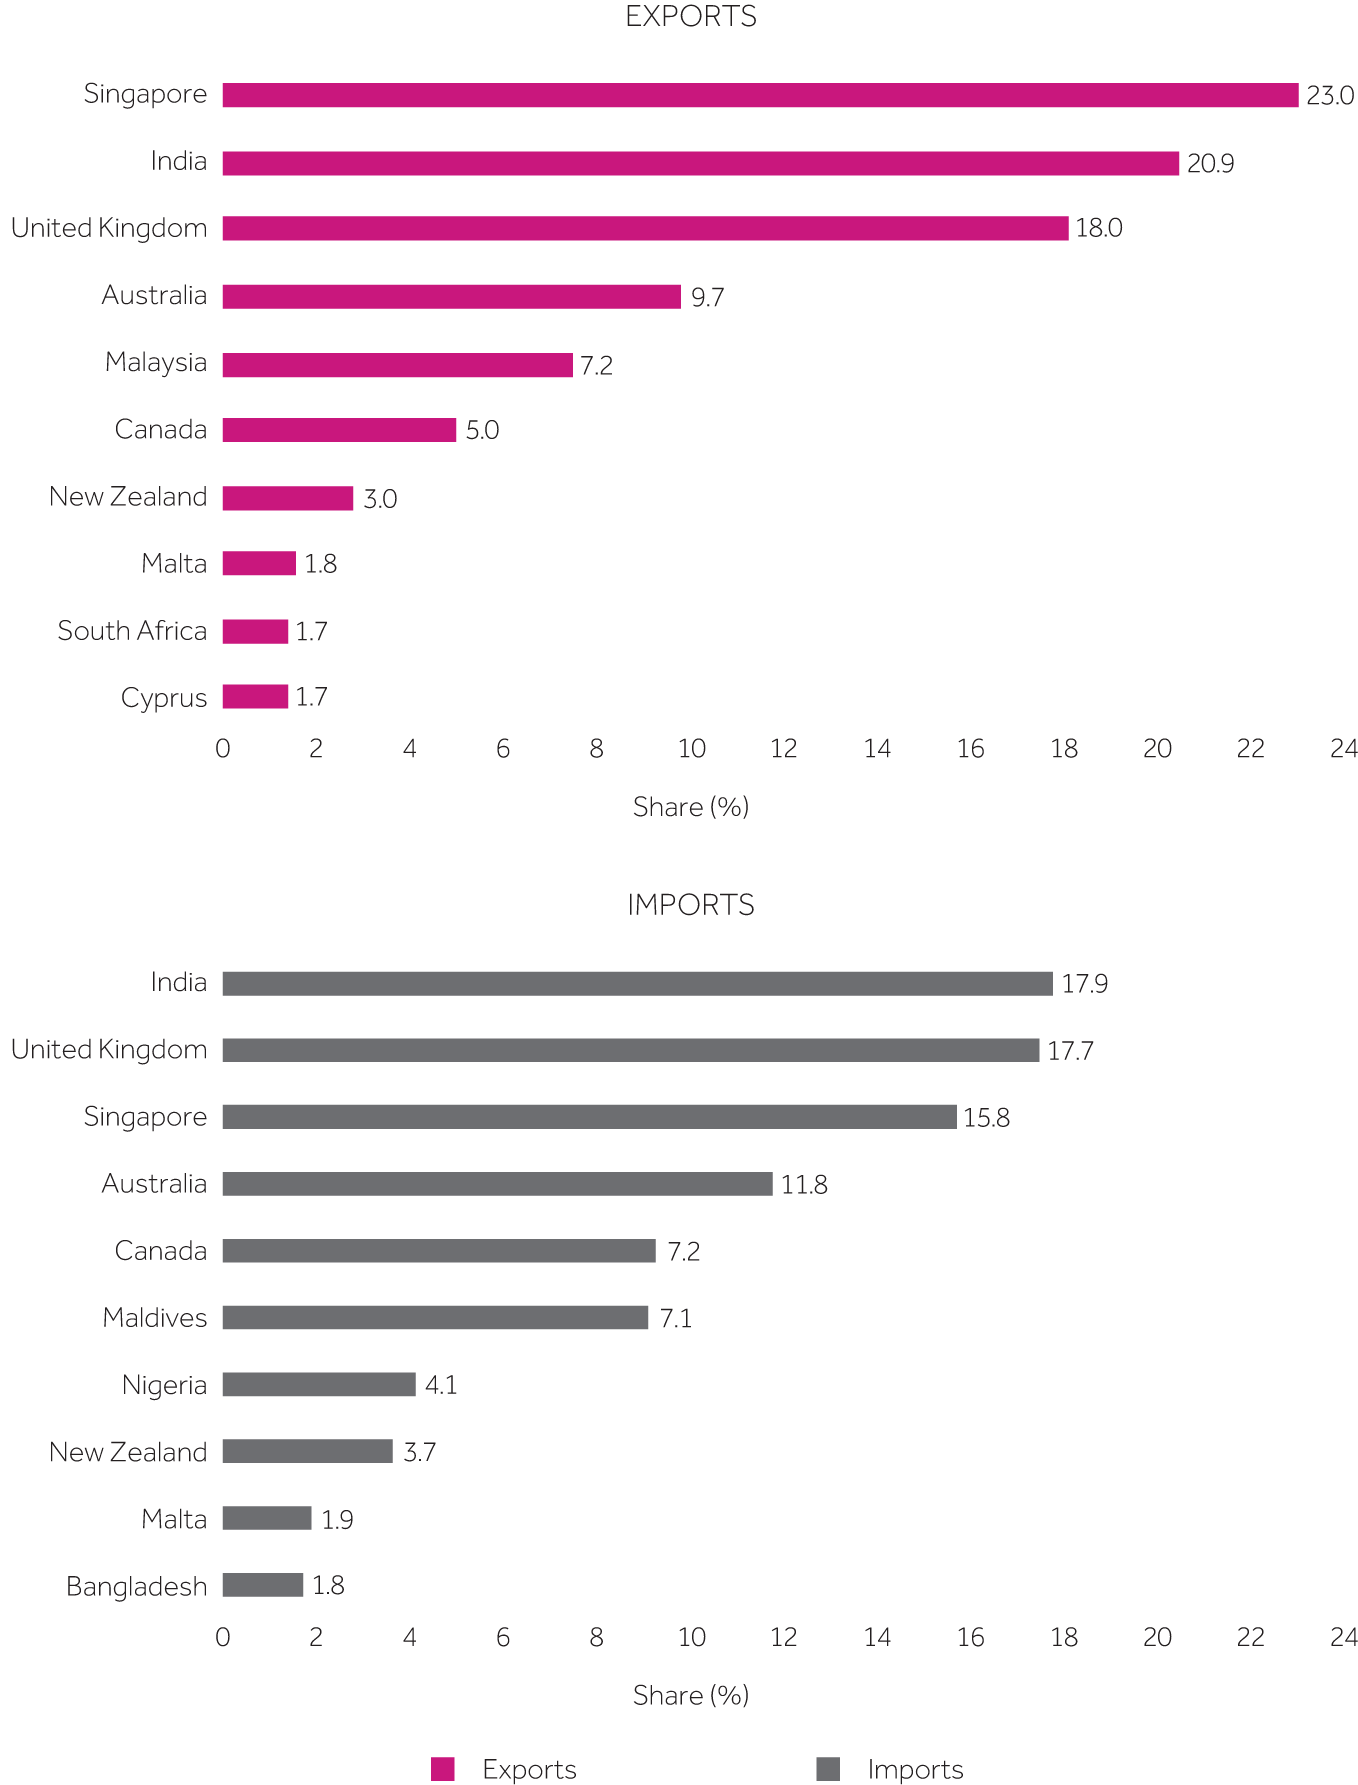 Source: Commonwealth Secretariat (calculated using OECD-BaTIS dataset)
 Source: Commonwealth Secretariat (estimated using WTO-OECD BaTIS dataset)
 Source: Commonwealth Secretariat (estimated using WTO-OECD BaTIS dataset)
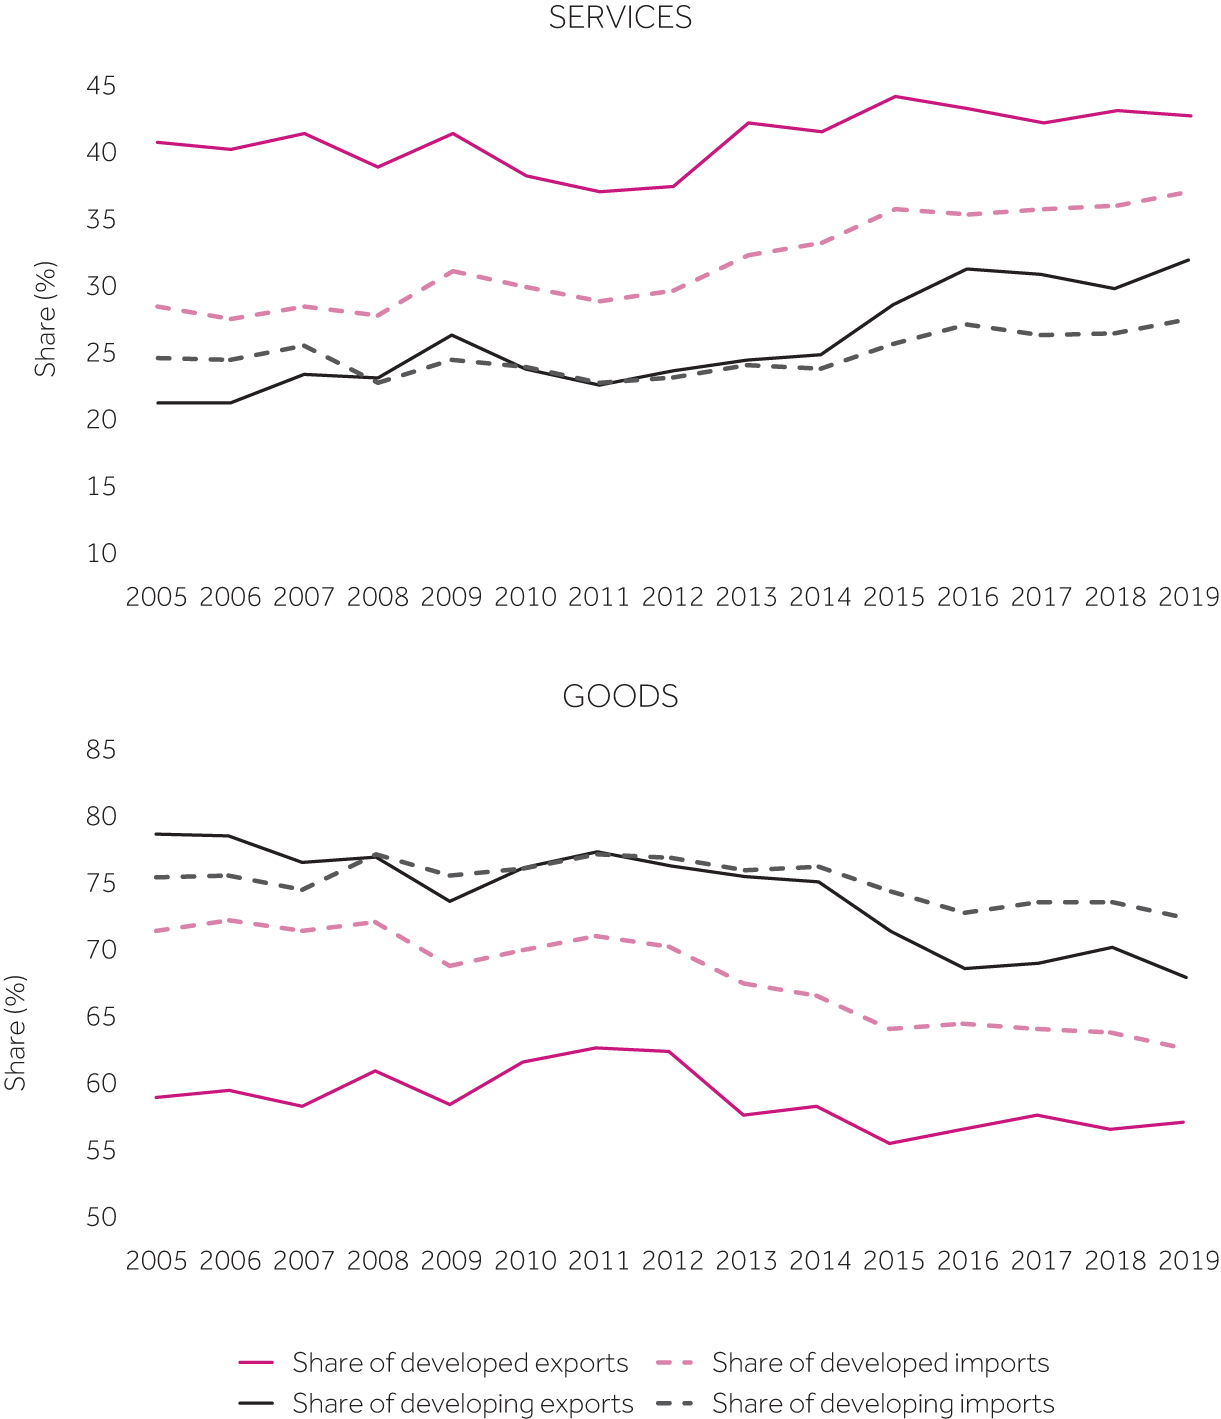 Source: Commonwealth Secretariat (calculated using UNCTADstat and OECD-WTO BaTIS dataset)
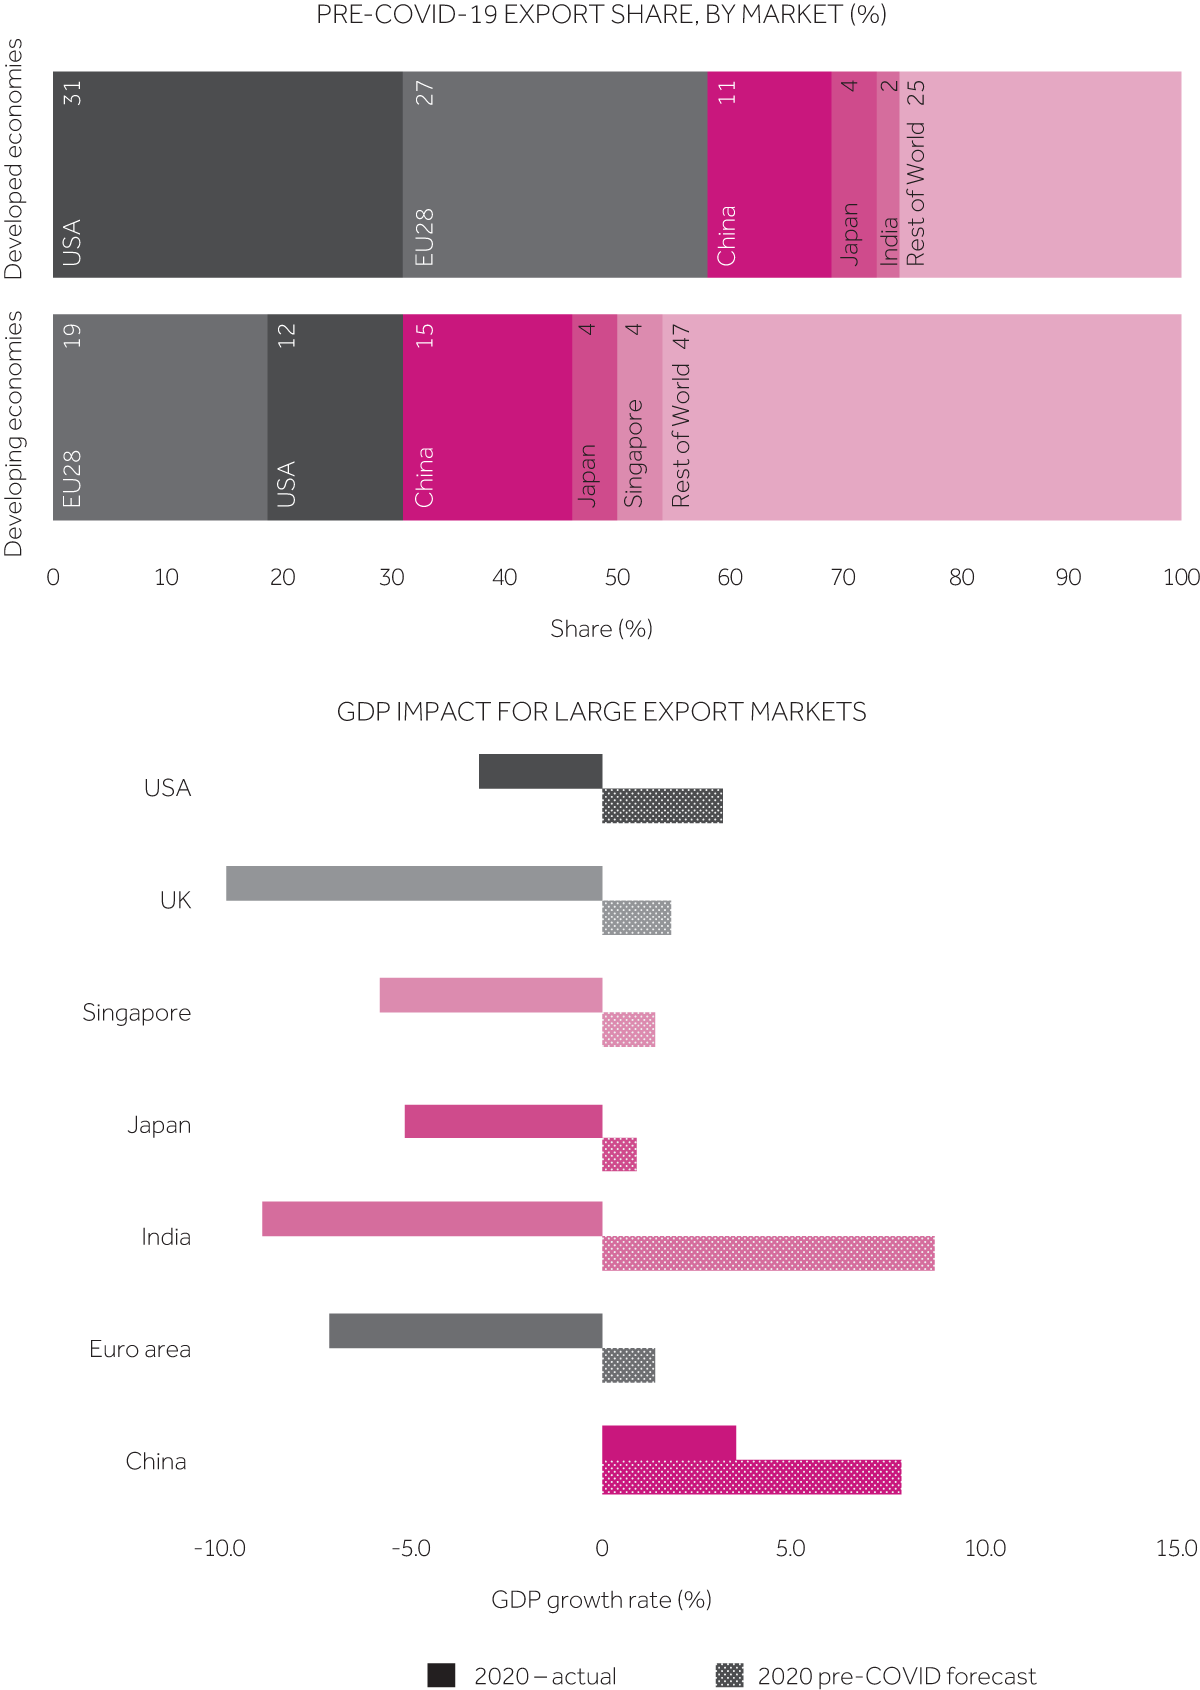 Note: The left panel reflects combined share of goods and services. EU-28 includes the UK because it was an EU member until 31 January 2020. China and Hong Kong are aggregated in the left panel.
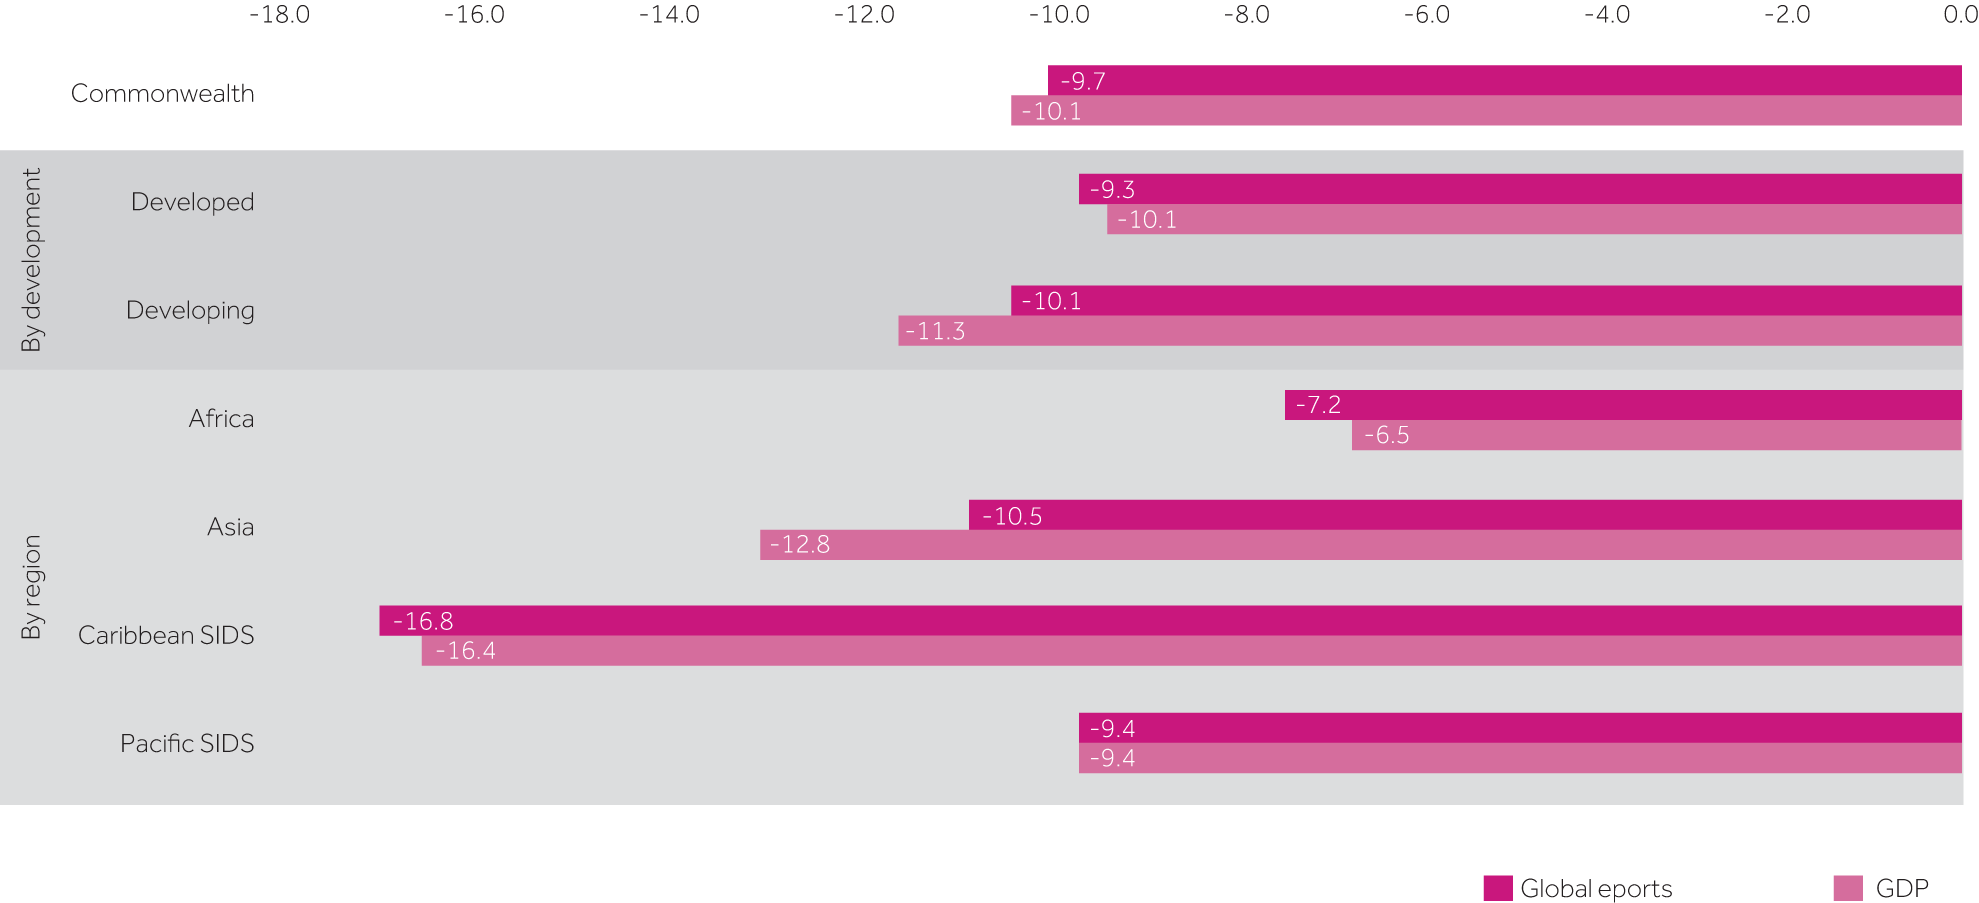 Note: Calculated as the difference between pre-COVID (October 2019) and in-COVID (April 2021) estimates of the IMF. The GDP estimates are used to compute trade flows at country and regional levels.
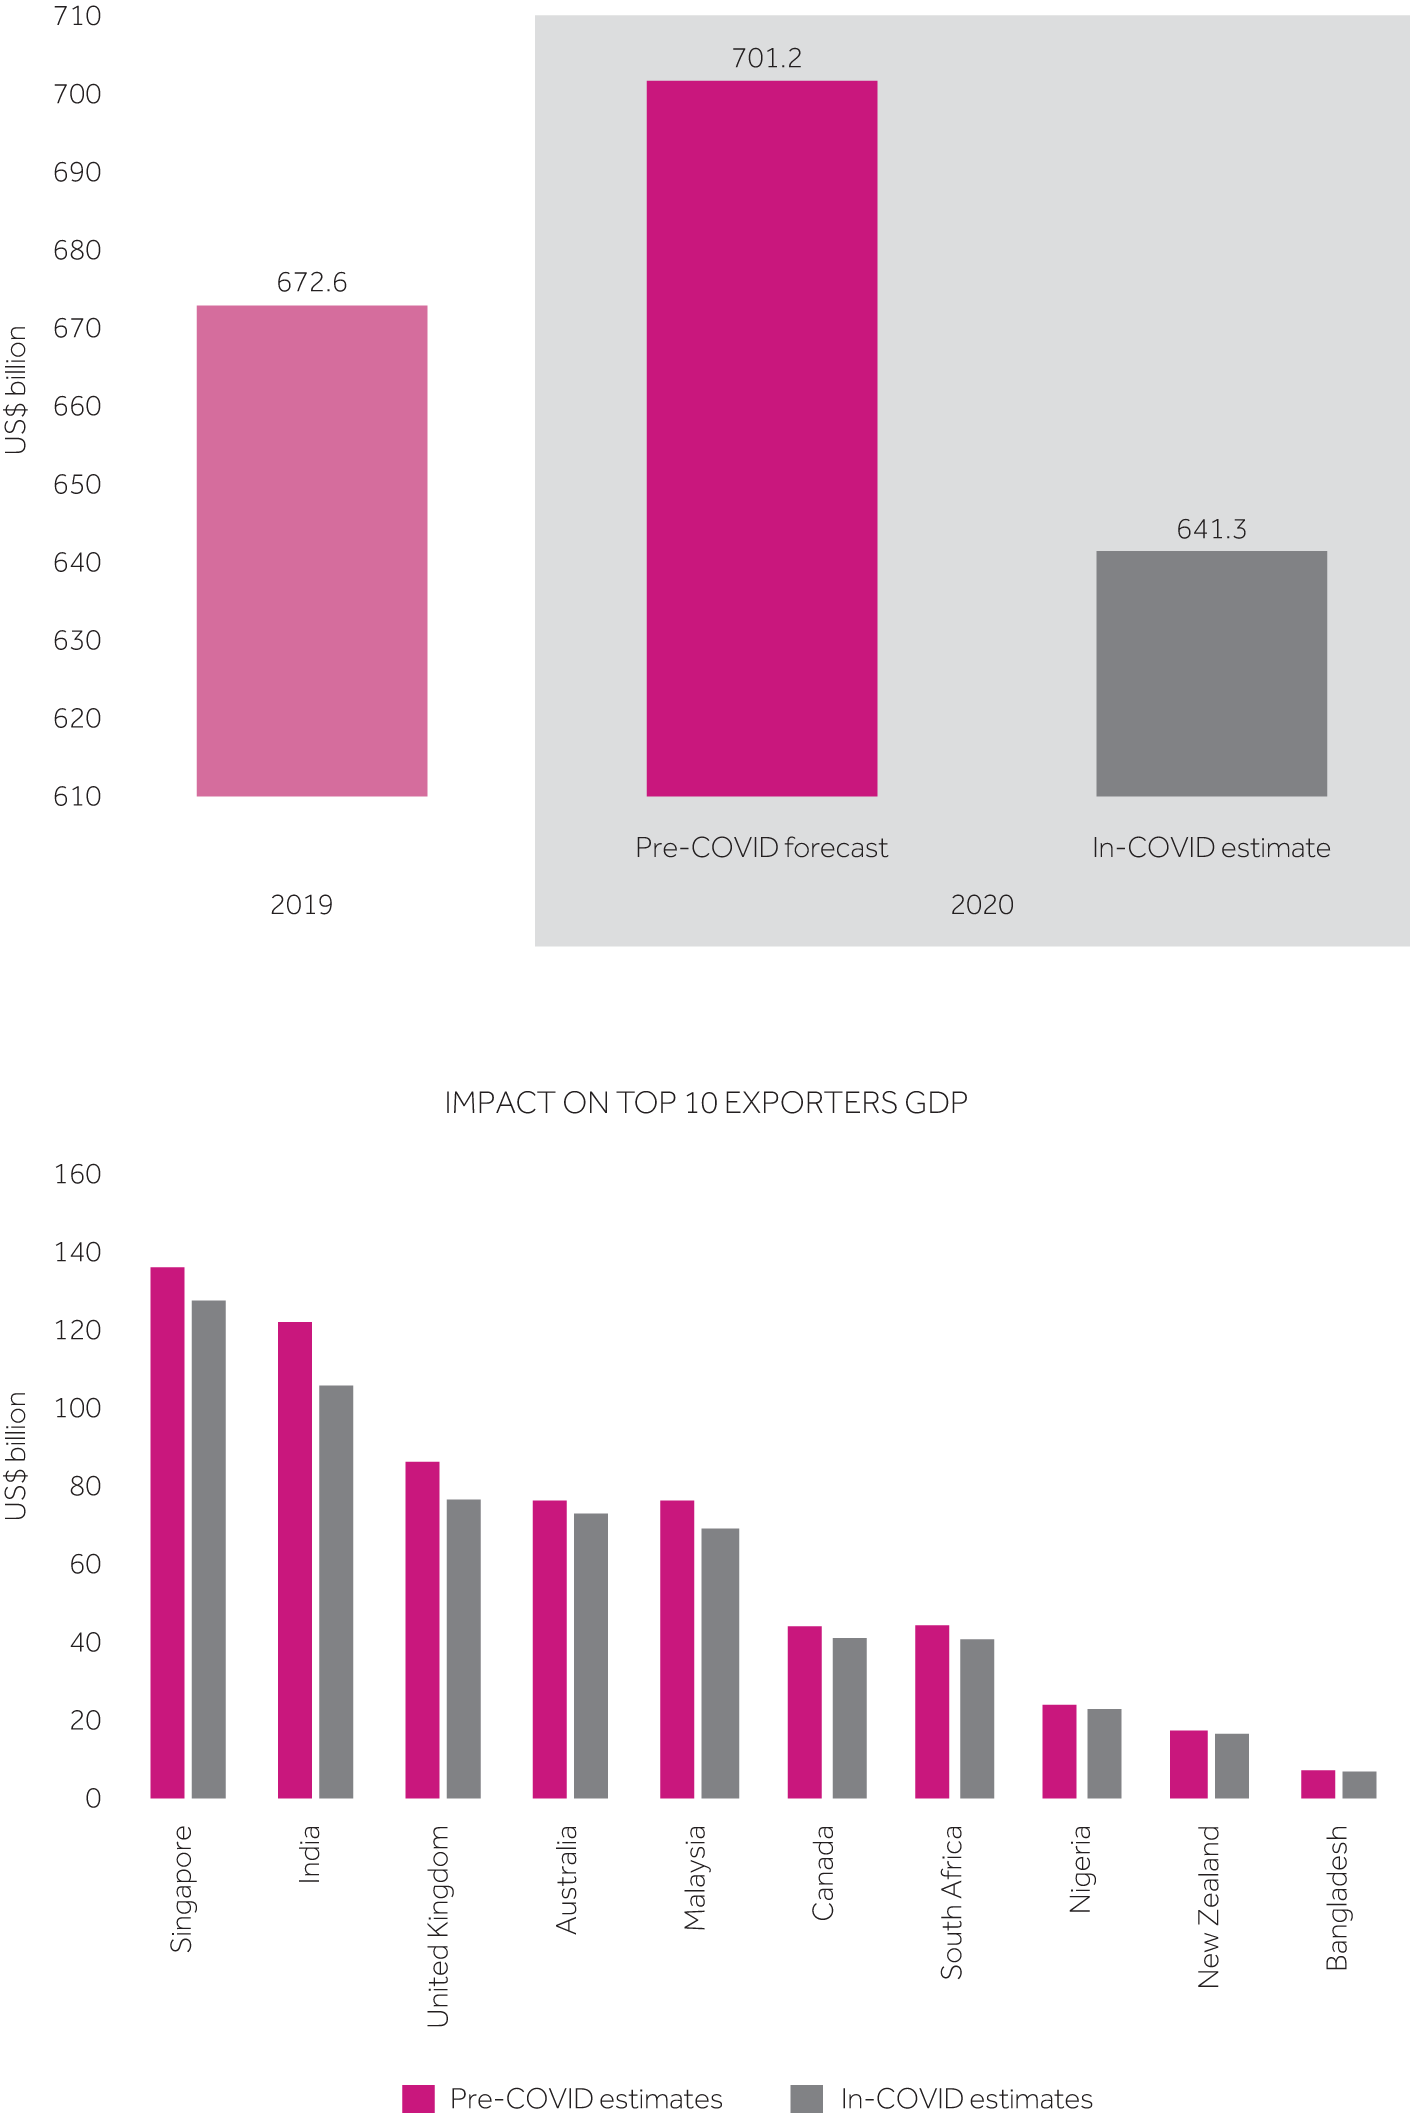 Note: Calculated as the difference between pre-COVID (October 2019) and in-COVID (April 2021) estimates of the IMF. The GDP estimates are used to compute trade flows at country and regional levels.
 Note: Exports are indexed to 1 in December 2019. As a result of data reporting delays in LDCs and small states, the chart contains information for only 25 Commonwealth countries.
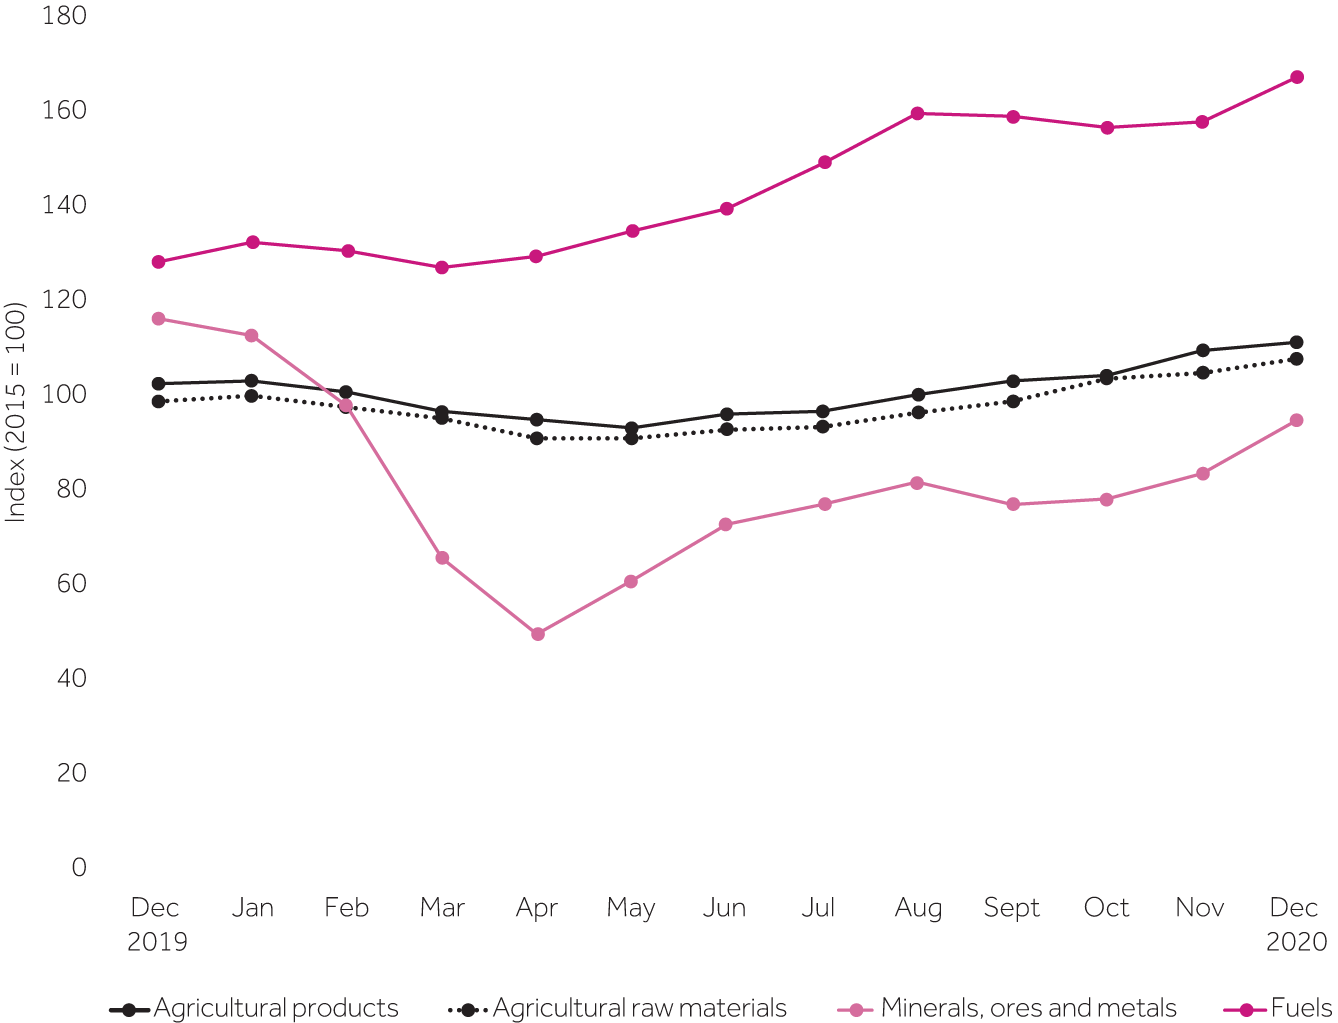 Source: Commonwealth Secretariat (calulated using data from UNCTADstat dataset)
 Note: The chart presents percentage change in exports in 2020 compared with the corresponding month in 2019 for selected Commonwealth countries that report monthly services export data to the WTO.
 Source: Commonwealth Secretariat (calculated using WTO TiSMoS dataset for 2017)
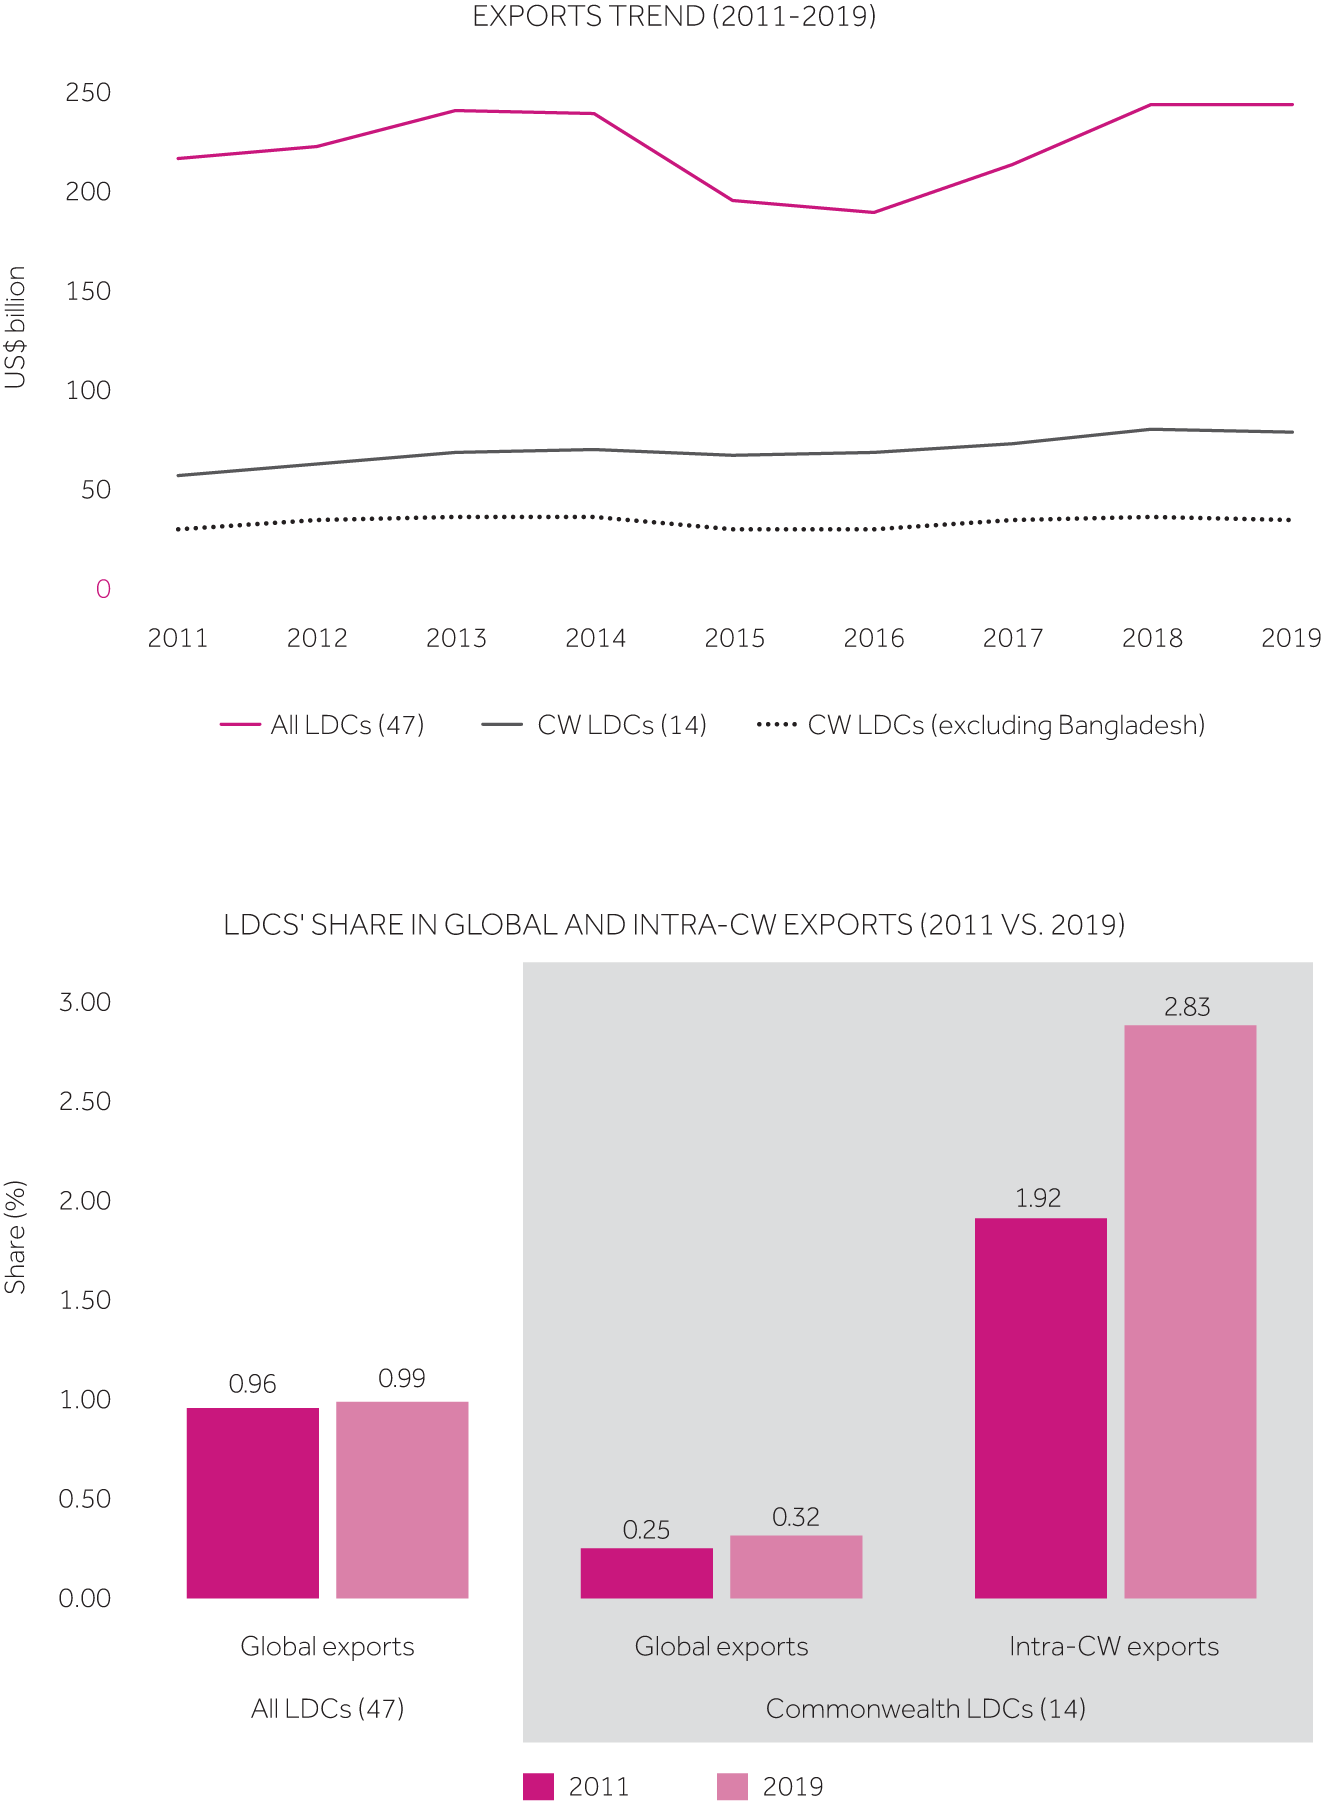 Note: The chart compares all LDCs' export share in world trade and 14 Commonwealth LDCs' share in world and intra-Commonwealth trade (goods and services combined) in 2011 and 2019.
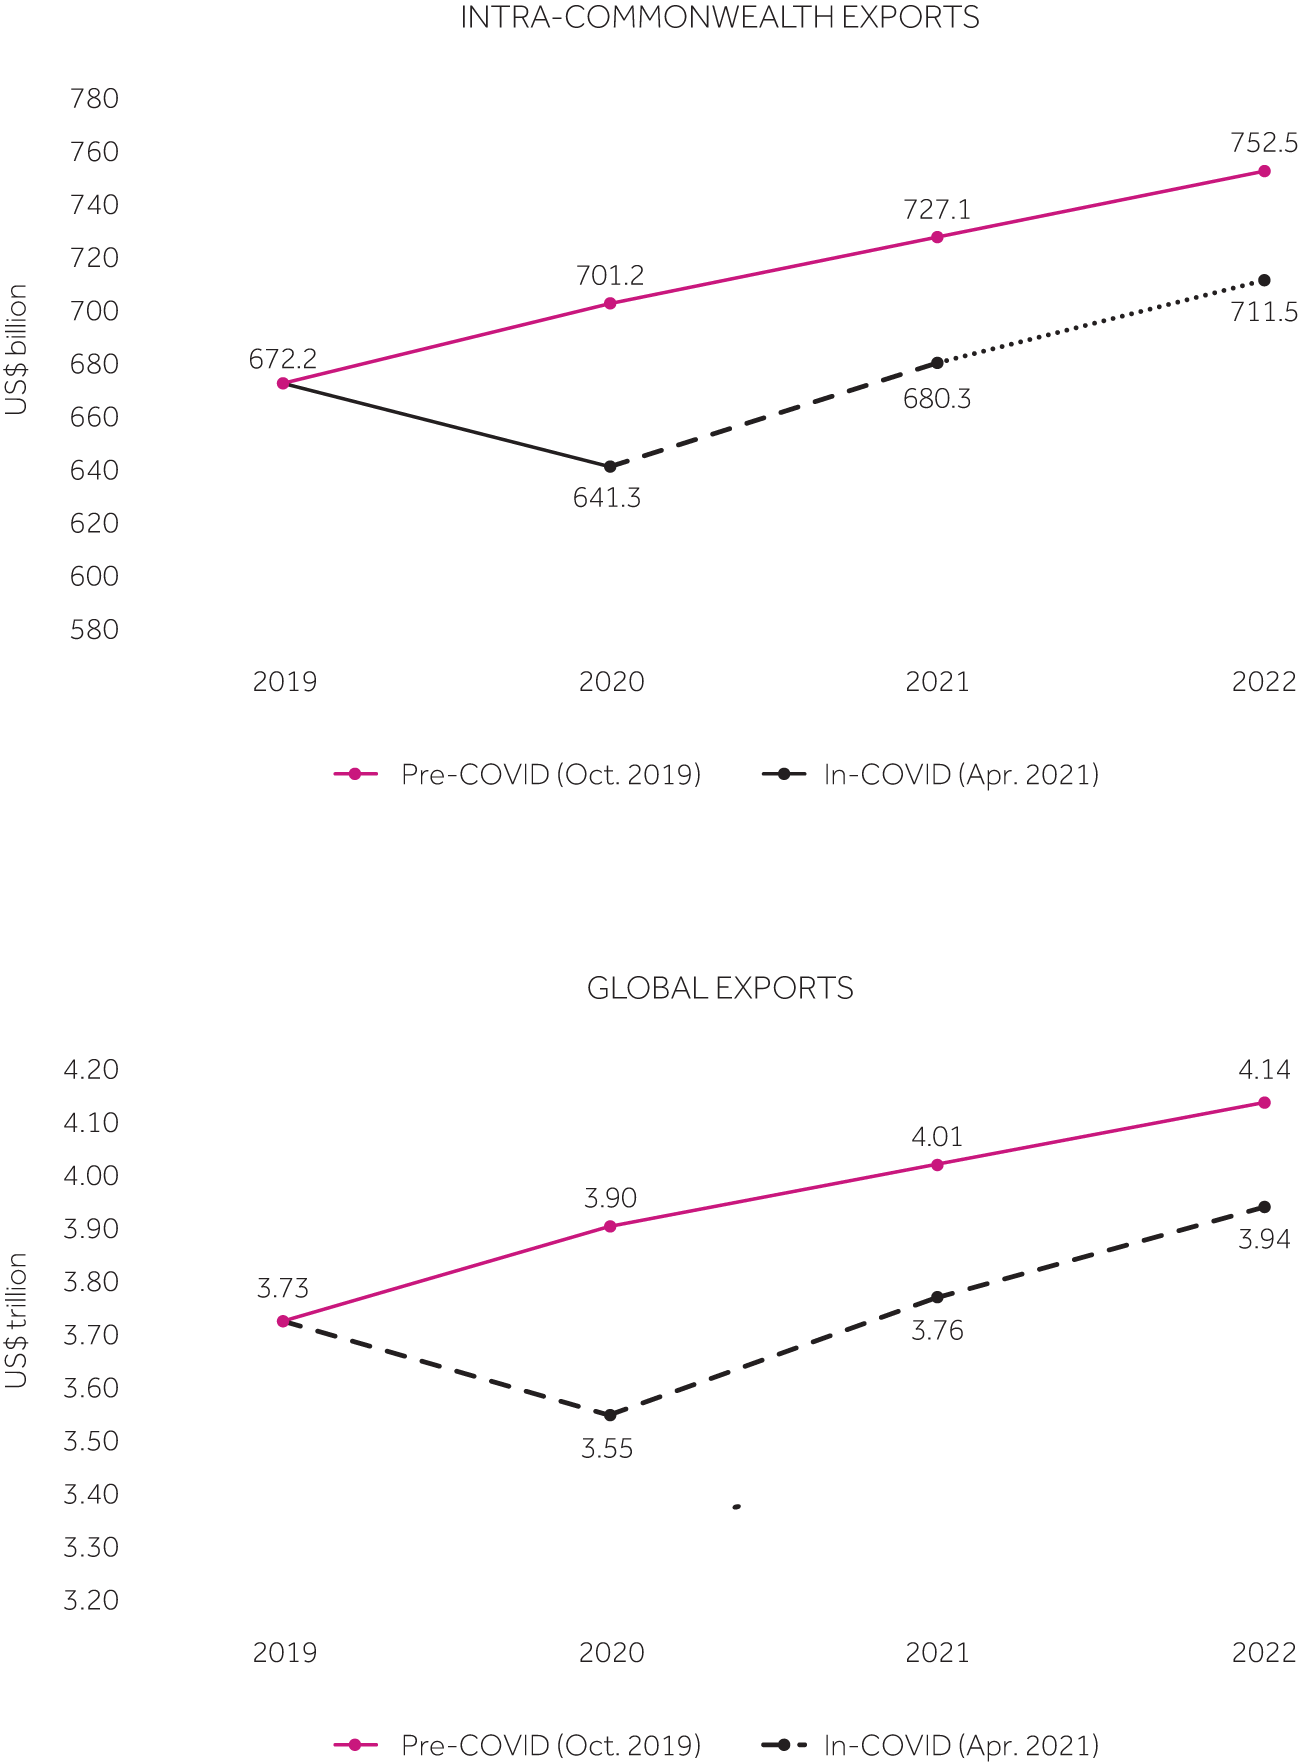 Source: Commonwealth Secretariat (calculated using UNCTADstat and OECD-WTO BaTIS dataset based on growth forecasts of the World Bank and IMF for individual economies)
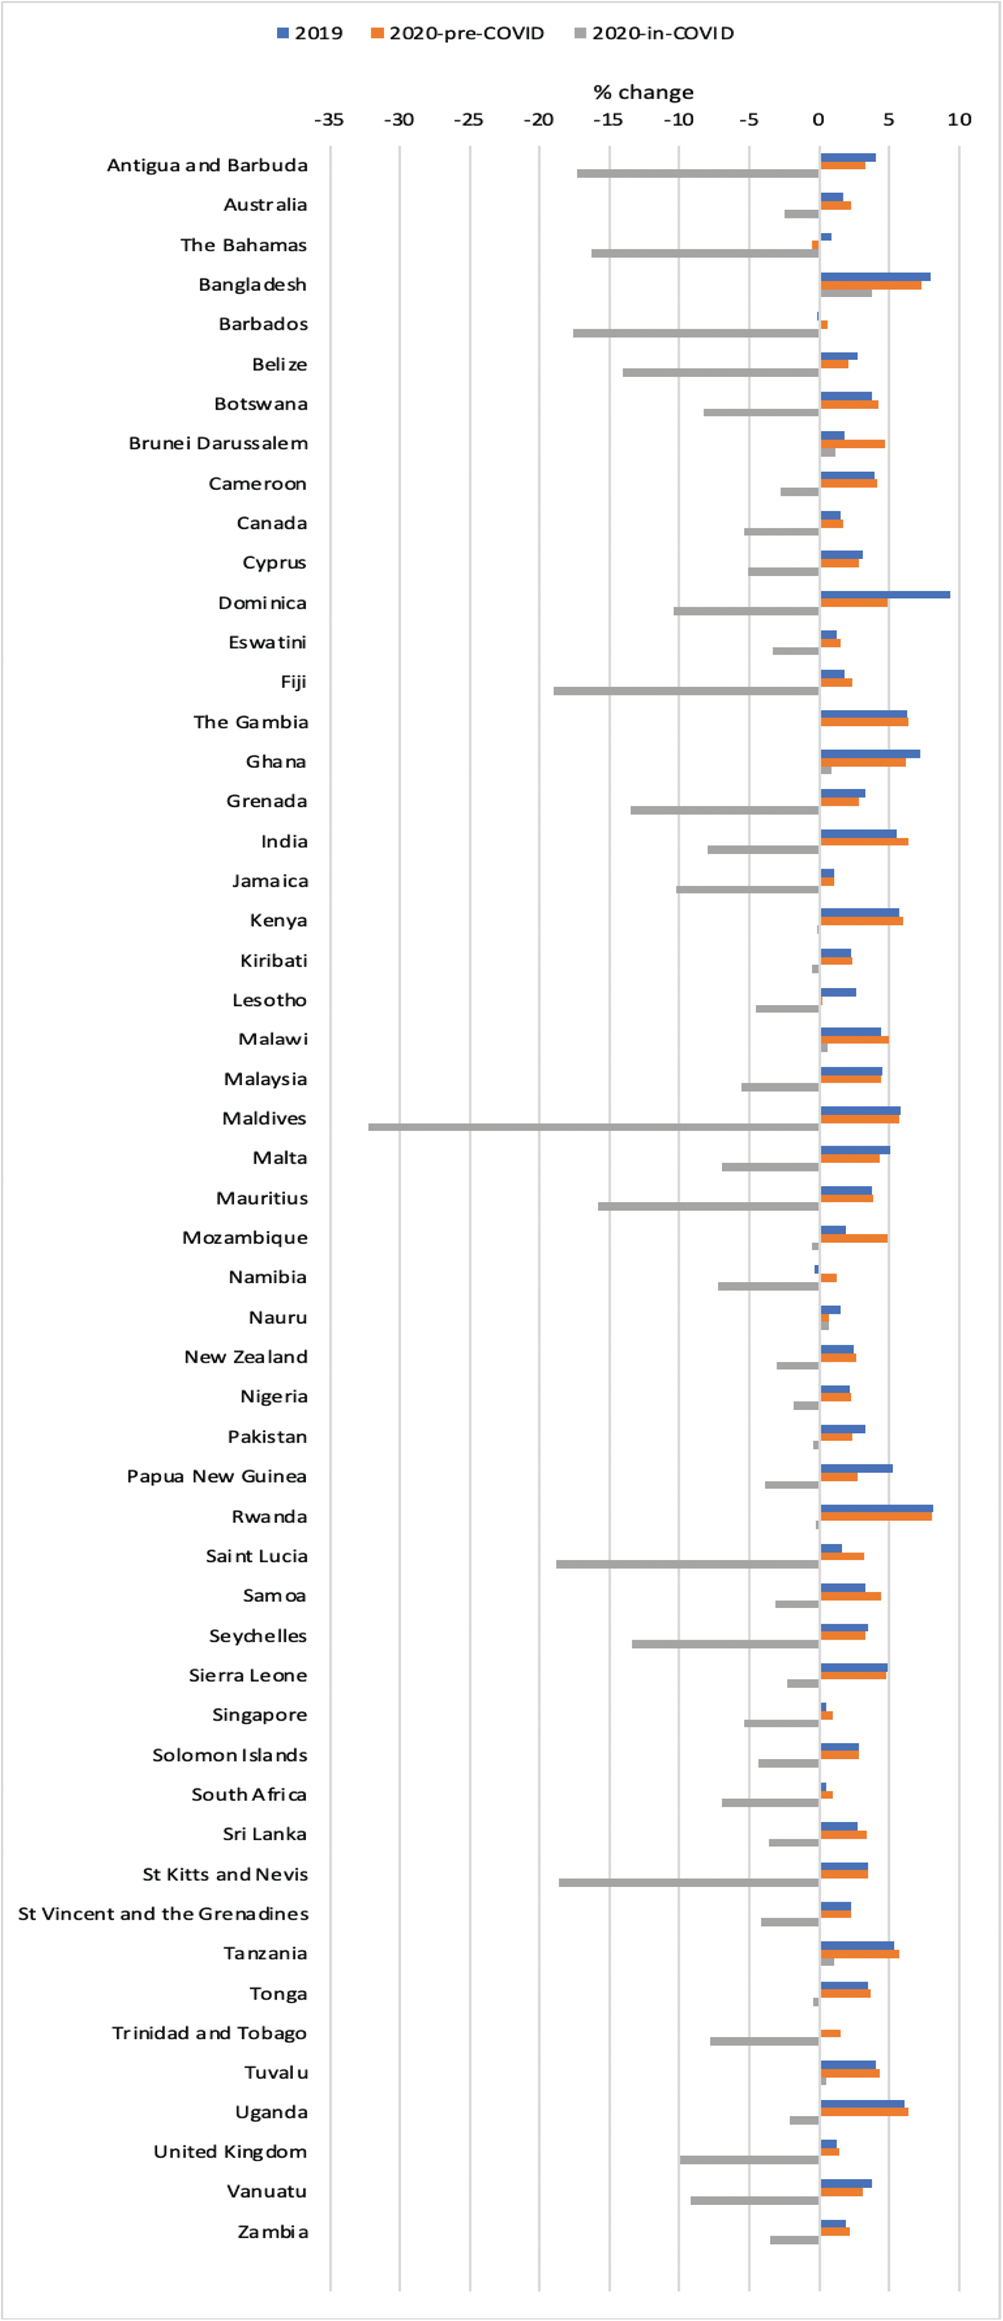
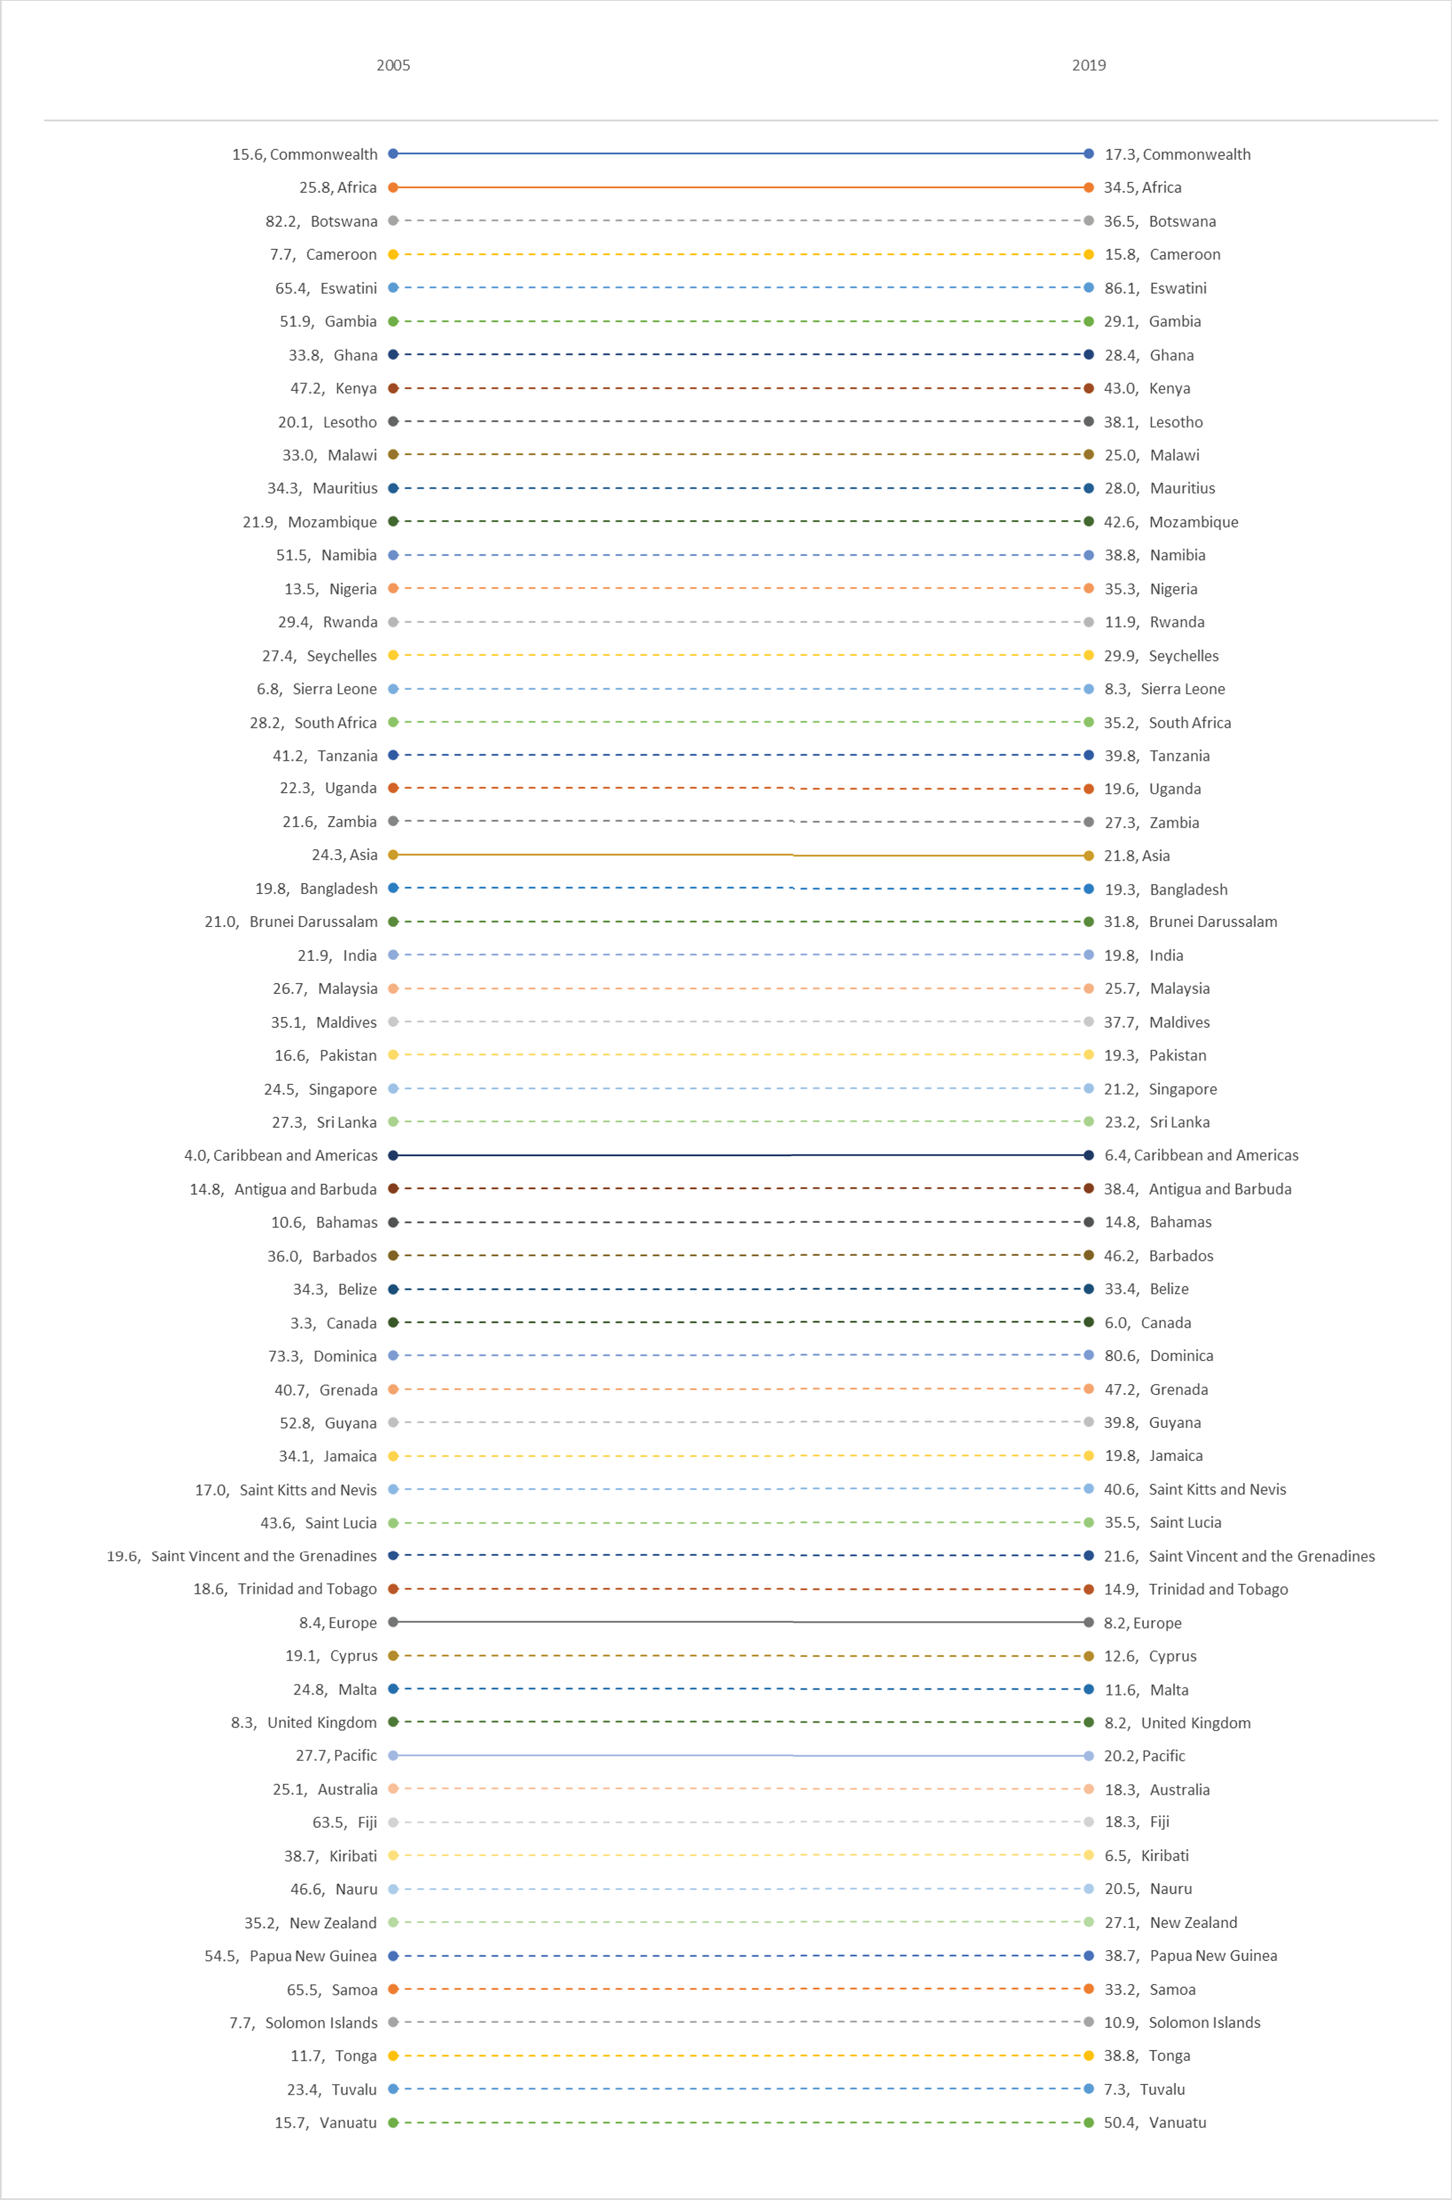 Source: Commonwealth Secretariat (calculated using UNCTADstat dataset)
